
Highs and bitcoin's share since 2015
- Highest close: $949.0B on 6 October 2025 with stablecoins, and $793.3B on 11 November 2021 without them. On 25 October 2026 they were $533.0B and $369.8B.
- Bitcoin's share of bitcoin plus these altcoins was 75.1% on 25 October 2026; it has ranged from 50.7% (8 Sep 2022) to 96.6% (22 Dec 2015). It runs above the tracked dominance above (70.5%) because SOL, TRX, HYPE, ADA, NEAR, XLM, HBAR and DOT, whose supply we have only captured since 23 October 2026, are not in it.
The full tracked set, hourly
Altcoins with stablecoinsWithout stablecoins
Bitcoin dominance
| Day (UTC) | Altcoins | Without stablecoins | Bitcoin dominance | Altcoin dominance |
|---|---|---|---|---|
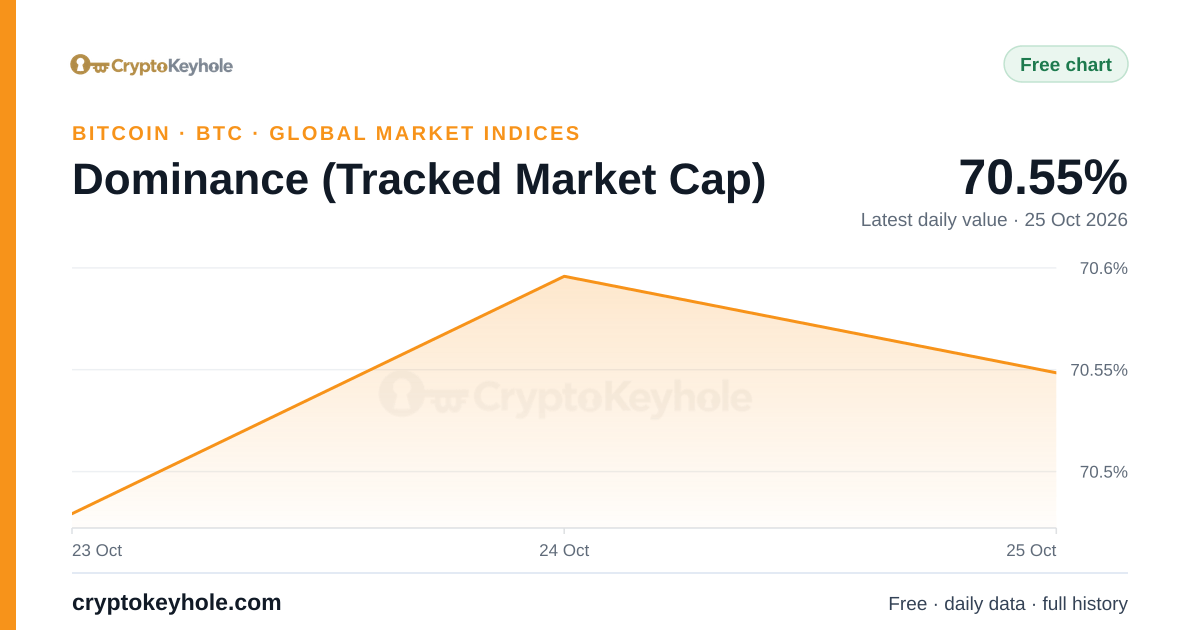
| 26 Oct 2026 so far | $674.1B | $510.9B | 70.5% | 29.5% |
| 25 Oct 2026 | $672.0B | $508.7B | 70.5% | 29.5% |
| 24 Oct 2026 | $676.9B | $513.5B | 70.6% | 29.4% |
| 23 Oct 2026 | $682.8B | $519.3B | 70.5% | 29.5% |
Our hourly record of every tracked coin's supply begins on 23 October 2026, so the full set's 30-day change appears from 23 November 2026 and its 90-day change from 22 January 2027. Until then the changes below use the altcoins we measure from our own nodes, which have the full history.
Changes over 7 to 365 days
| Over the last | Altcoins (own-node supply) | Without stablecoins | Bitcoin market cap | All tracked altcoins |
|---|---|---|---|---|
| 7 days | −2.5% | −3.4% | −2.3% | from 31 Oct 2026 |
| 30 days | −10.9% | −14.5% | −4.7% | from 23 Nov 2026 |
| 90 days | +15.1% | +25.0% | +26.0% | from 22 Jan 2027 |
| 365 days without LIT, ZAMA, SENT and EDGE | −35.1% | −42.1% | −27.7% | from 24 Oct 2027 |
The first three columns compare the same coins on both days (a coin that joined our records in between is left out of that change), from daily closes. The last column is the full tracked set, which needs that many days of its own record.
The largest altcoins
| # | Coin | Market cap | Share of altcoins | Price, 30 days | Price, 90 days |
|---|---|---|---|---|---|
| 1 | ETH Ethereum | $284.3B | 42.2% | −13.4% | +23.2% |
| 2 | Stablecoins US-dollar stablecoins on Ethereum | $163.2B | 24.2% | – | – |
| 3 | SOL Solana | $60.2B | 8.9% | −15.6% | +39.1% |
| 4 | TRX TRON | $31.5B | 4.7% | −1.6% | +2.0% |
| 5 | HYPE Hyperliquid | $23.6B | 3.5% | −15.4% | +42.4% |
| 6 | DOGE Dogecoin | $12.2B | 1.8% | −20.4% | +11.3% |
| 7 | LINK Chainlink | $8.87B | 1.3% | −19.3% | +39.5% |
| 8 | ADA Cardano | $7.61B | 1.1% | −19.6% | +31.8% |
| 9 | UNI Uniswap | $6.31B | 0.94% | −26.6% | +84.0% |
| 10 | NEAR Near | $6.10B | 0.91% | −3.9% | +182.8% |
| 11 | XLM Stellar | $6.00B | 0.89% | −22.0% | −0.2% |
| 12 | BCH Bitcoin Cash | $5.60B | 0.83% | −17.0% | +31.8% |
| 13 | WLFI World Liberty Financial | $5.18B | 0.77% | −9.3% | −2.4% |
| 14 | WLD Worldcoin | $4.48B | 0.67% | −12.3% | +39.1% |
| 15 | LTC Litecoin | $4.44B | 0.66% | −21.7% | +23.7% |
| 16 | ONDO Ondo | $4.23B | 0.63% | −23.3% | +4.7% |
| 17 | HBAR Hedera Hashgraph | $3.44B | 0.51% | −17.6% | +14.1% |
| 18 | MNT Mantle | $3.21B | 0.48% | −26.5% | +29.8% |
| 19 | QNT Quant | $3.17B | 0.47% | +92.5% | +247.8% |
| 20 | ENA Ethena | $3.16B | 0.47% | −24.3% | +151.8% |
| Other coins 35 more | $27.3B | 4.1% | – | – |
- Ether alone is 42.2% of the altcoin market cap and 55.7% of it without stablecoins; the stablecoins on Ethereum are 24.2%.
- The three largest altcoins other than stablecoins (ETH, SOL and TRX) make up 73.6% of the market cap without stablecoins.
Price changes compare the latest hour with the same hour 30 and 90 days earlier. Every tracked coin, with its supply and source, is on the crypto market cap page.
What is counted
Every figure here is for the coins the site tracks. Supply comes from our own nodes for Bitcoin, Ethereum, the UTXO coins we run (Litecoin, Dogecoin and Bitcoin Cash) and the Ethereum tokens; each token counts every unit outside burn addresses, including those still held by issuers, treasuries and vesting contracts. For Solana (SOL), TRON (TRX), Hyperliquid (HYPE), Cardano (ADA), Near (NEAR), Stellar (XLM), Hedera Hashgraph (HBAR) and Polkadot (DOT), it is the circulating supply each network's own public interface publishes, read hourly since 23 October 2026. The stablecoins are the US-dollar stablecoins issued on Ethereum, at face value.
Not counted:
- XRP: the XRP Ledger reports only the XRP in existence, about 40% of it held in escrow.
- BNB: no free public endpoint of the BNB Chain teams publishes its supply.
- TON: no free public endpoint of the TON teams publishes its circulating supply.
- WBTC: wrapped bitcoin: its coins are BTC already counted in BTC's supply.
- AVAX: the Avalanche P-Chain reports only an upper bound of the AVAX in existence, which ignores burned fees.
- SUI: the Sui network's public interface reports only the fixed total of 10 billion, most of it still locked.
- ARB: the ARB token contract reports only the fixed total of 10 billion, much of it still unvested.
- APT: the Aptos framework reports only the APT in existence, much of it locked in staking and vesting.
- Stablecoins issued on other networks (Tron, Solana, BNB Chain and layer-2 networks).
So the altcoin market cap here is lower than whole-market totals, and bitcoin's share is higher.
How it is calculated
The tracked market cap is the sum of each tracked coin's price times its supply at the end of each hour: the price from the coin's own price chart (our hourly index), the supply as described under "What is counted", the stablecoins at face value. The altcoin market cap is that total less bitcoin's market cap; the figure without stablecoins also leaves out the US-dollar stablecoins on Ethereum. Altcoin dominance is the altcoin market cap as a share of the total, which is 100% less bitcoin dominance. These are the same figures as on our crypto market cap page and its charts, at the same hour.
The record of every tracked coin's supply begins on 23 October 2026, so the long history uses the altcoins whose supply comes from our own nodes: Ethereum, the UTXO coins we run, the Ethereum tokens and the stablecoins on Ethereum, at each daily close (00:00 UTC). A coin counts from the start of its first 60 days in a row with both a daily price and a daily supply in our records, so a thinly traded start leaves no gaps; for some tokens that is later than their first trade. A day on which a counted coin has no value is left out of the chart, never filled in. Changes over 7 to 365 days compare the same coins on both days.
The figures update every hour, about ten minutes after the hour's prices and supplies are published. Free to reuse under CC BY 4.0, crediting CryptoKeyhole with a link to this page.
Questions
What is the altcoin market cap today?
What is altcoin dominance?
Why is bitcoin dominance higher here than on some other sites?
Because we count only coins whose supply we can read from our own nodes or from the network itself. Several large coins publish no circulating supply we can read (XRP, BNB and TON among them), and we count only the stablecoins issued on Ethereum. Leaving them out lowers the altcoin total and raises bitcoin's share.
Does the altcoin market cap include stablecoins?
This page shows both. The first figure counts everything but bitcoin, stablecoins included; the second leaves the stablecoins out, so it follows only coins whose price moves.
What was the highest altcoin market cap?
Open the tracked market cap chartBitcoin dominance chartCreate a free accountAll free tools
Market caps are calculated by CryptoKeyhole from our own nodes, the supply each network publishes and our own price indexes, for the coins we track only. Nothing here is investment advice.