
How far below the high
- The highest daily close on record is $124,766.50, on 6 October 2025.
- At $80,207 (today so far, to 15:00 UTC), Bitcoin is 35.7% below it. A rise of +55.6% would take it back to the high.
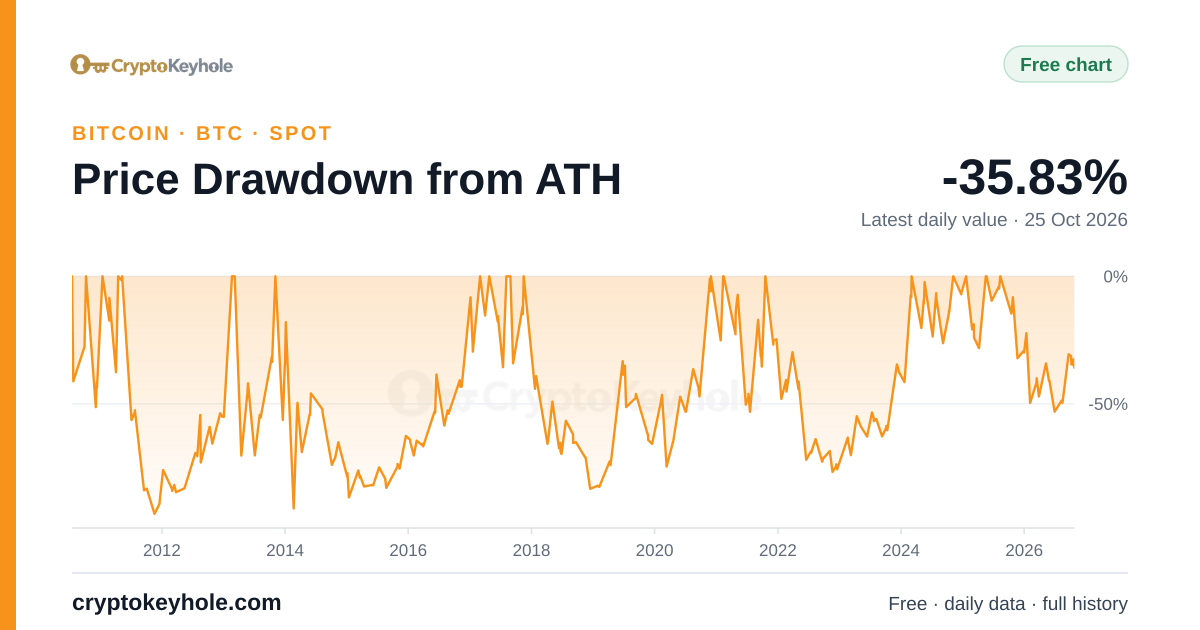
- The last close, $80,066 on 25 Oct 2026, was 35.8% below the high; our drawdown chart shows that figure for every day since 2010.
- 385 days have passed since the high. The longest wait between two all-time-high closes was 1,184 days, from 4 December 2013 to 2 March 2017; this wait is the 5th longest so far.
- The lowest close since the high was $58,531.90 on 30 June 2026, 53.1% below it, 267 days after the peak.
Every new all-time high
- 247 daily closes since 17 July 2010 were higher than every close before them (the first close of our record counts as the first). 8 calendar years had at least one; 2017 had the most, 72.
- The longest run of new highs on consecutive days was 8 days, from 30 November 2017 to 7 December 2017.
- The latest new high was the close of 6 October 2025.
| Year | New all-time-high closes | First | Last | Highest close |
|---|---|---|---|---|
| 2026 so far | 0 | – | – | – |
| 2025 | 14 | 21 Jan 2025 | 6 Oct 2025 | $124,766.50 |
| 2024 | 25 | 4 Mar 2024 | 17 Dec 2024 | $106,151.90 |
| 2023 | 0 | – | – | – |
| 2022 | 0 | – | – | – |
| 2021 | 21 | 1 Jan 2021 | 8 Nov 2021 | $67,549.14 |
| 2020 | 11 | 30 Nov 2020 | 31 Dec 2020 | $28,972.40 |
| 2019 | 0 | – | – | – |
| 2018 | 0 | – | – | – |
| 2017 | 72 | 2 Mar 2017 | 16 Dec 2017 | $19,345.49 |
| 2016 | 0 | – | – | – |
| 2015 | 0 | – | – | – |
| 2014 | 0 | – | – | – |
| 2013 | 51 | 20 Feb 2013 | 4 Dec 2013 | $1,237.55 |
| 2012 | 0 | – | – | – |
| 2011 | 36 | 14 Jan 2011 | 8 Jun 2011 | $29.60 |
| 2010 | 17 | 17 Jul 2010 | 6 Nov 2010 | $0.39 |
| Last high before the wait | Next new high | Days |
|---|---|---|
| 4 Dec 2013 | 2 Mar 2017 | 1,184 |
| 16 Dec 2017 | 30 Nov 2020 | 1,080 |
| 8 Nov 2021 | 4 Mar 2024 | 847 |
| 8 Jun 2011 | 20 Feb 2013 | 623 |
| 13 Mar 2024 | 6 Nov 2024 | 238 |
| 6 Oct 2025 | not yet | 385 so far |
Each cycle's peak and its fall
| Cycle peak | Peak close | Days after the halving | Lowest close after the peak | Fall | Days to the low | Back above the peak | Times the previous peak |
|---|---|---|---|---|---|---|---|
| 2011 | $29.60 8 Jun 2011 | – | $2.05 18 Nov 2011 | −93.1% | 163 | 20 Feb 2013 623 days after the peak | – |
| 2013 | $1,237.55 4 Dec 2013 | 371 halving of 28 Nov 2012 | $164.92 14 Jan 2015 | −86.7% | 406 | 2 Mar 2017 1,184 days after the peak | 41.8× |
| 2017 | $19,345.49 16 Dec 2017 | 525 halving of 9 Jul 2016 | $3,232.51 15 Dec 2018 | −83.3% | 364 | 30 Nov 2020 1,080 days after the peak | 15.6× |
| 2021 | $67,549.14 8 Nov 2021 | 546 halving of 11 May 2020 | $15,760.19 21 Nov 2022 | −76.7% | 378 | 4 Mar 2024 847 days after the peak | 3.5× |
| 2025 current, so far | $124,766.50 6 Oct 2025 | 534 halving of 20 Apr 2024 | $58,531.90 30 Jun 2026 | −53.1% | 267 | not yet | 1.8× |
- Falls from the completed cycle peaks: 93.1% (2011), 86.7% (2013), 83.3% (2017), 76.7% (2021); each was smaller than the one before.
- The current cycle began with the high of 6 October 2025; its lowest close so far is 53.1% below the peak.
A cycle peak is an all-time-high close followed by a fall of at least 75% before any higher close, the rule our cycle charts use; the latest all-time high starts the current cycle. The lowest close is the lowest daily close after the peak before Bitcoin closed above it again. Halving days are the UTC days whose last block reached each 210,000-block height, from our own node.
All-time highs of every coin we cover
- None of the 63 coins trades within 10% of its all-time-high close; the median coin is 84.7% below its high.
- Closest to their highs: Hyperliquid (21.5% below the high), TRON (23.8% below the high), SKY Governance Token (29.3% below the high).
- Furthest from their highs: ApeCoin (99.5% below the high), Axie Infinity (99.4% below the high), The Sandbox (99.4% below the high).
- A young coin's high is the highest close since its record starts, which can be its first weeks of trading.
| Coin | Price | All-time high close | From the high | Days since the high | Record from |
|---|---|---|---|---|---|
| Bitcoin BTC | $80,207 | $124,766 6 Oct 2025 | −35.7% | 385 | 17 Jul 2010 |
| Ethereum ETH | $2,327 | $4,832 22 Aug 2025 | −51.8% | 430 | 7 Aug 2015 |
| Solana SOL | $101.40 | $261.97 18 Jan 2025 | −61.3% | 645 | 10 Apr 2020 |
| XRP XRP | $1.30 | $3.55 22 Jul 2025 | −63.5% | 460 | 7 Aug 2015 |
| TRON TRX | $0.3304 | $0.4334 3 Dec 2024 | −23.8% | 691 | 31 Oct 2017 |
| BNB BNB | $738.69 | $1,307 8 Oct 2025 | −43.5% | 382 | 14 Jul 2017 |
| Dogecoin DOGE | $0.07693 | $0.6898 7 May 2021 | −88.8% | 1,997 | 7 Aug 2015 |
| Toncoin TON | $1.25 | $8.19 14 Jun 2024 | −84.7% | 863 | 12 Nov 2021 |
| Chainlink LINK | $11.57 | $52.27 9 May 2021 | −77.9% | 1,996 | 28 Sep 2017 |
| Hyperliquid HYPE | $76.34 | $97.23 22 Sep 2026 | −21.5% | 33 | 7 Dec 2024 |
| Wrapped Bitcoin WBTC | $80,279 | $124,646 6 Oct 2025 | −35.6% | 385 | 24 Nov 2018 |
| Cardano ADA | $0.2042 | $2.97 3 Sep 2021 | −93.1% | 1,878 | 30 Nov 2017 |
| Near NEAR | $4.60 | $20.18 14 Jan 2022 | −77.2% | 1,745 | 14 Oct 2020 |
| Stellar XLM | $0.1681 | $0.8914 3 Jan 2018 | −81.1% | 3,217 | 7 Aug 2015 |
| Bitcoin Cash BCH | $278.90 | $3,747 20 Dec 2017 | −92.6% | 3,231 | 2 Aug 2017 |
| Litecoin LTC | $56.73 | $387.80 9 May 2021 | −85.4% | 1,995 | 30 Jul 2015 |
| Uniswap UNI | $7.11 | $43.11 4 May 2021 | −83.5% | 2,001 | 18 Sep 2020 |
| Avalanche AVAX | $8.93 | $134.84 22 Nov 2021 | −93.4% | 1,798 | 22 Sep 2020 |
| Sui SUI | $0.9205 | $5.29 4 Jan 2025 | −82.6% | 659 | 3 May 2023 |
| Hedera Hashgraph HBAR | $0.0775 | $0.505 15 Sep 2021 | −84.7% | 1,866 | 17 Sep 2019 |
| Worldcoin WLD | $0.4484 | $11.69 9 Mar 2024 | −96.2% | 961 | 25 Jul 2023 |
| World Liberty Financial WLFI | $0.0536 | $0.2436 21 Sep 2025 | −78.0% | 400 | 2 Sep 2025 |
| Lighter LIT | $3.15 | $5.31 23 Sep 2026 | −40.6% | 33 | 16 Jan 2026 |
| Mantle MNT | $0.5157 | $2.69 8 Oct 2025 | −80.8% | 383 | 18 Jul 2023 |
| Shiba Inu SHIB | $0.0000049 | $0.00007906 27 Oct 2021 | −93.8% | 1,825 | 11 May 2021 |
| Quant QNT | $213.14 | $394.20 10 Sep 2021 | −45.9% | 1,872 | 25 Jun 2021 |
| Ethena ENA | $0.2105 | $1.46 10 Apr 2024 | −85.6% | 929 | 3 Apr 2024 |
| Morpho MORPHO | $2.07 | $3.92 18 Jan 2025 | −47.1% | 646 | 22 Nov 2024 |
| Aave AAVE | $137.97 | $628.75 18 May 2021 | −78.1% | 1,987 | 16 Oct 2020 |
| Ondo ONDO | $0.4229 | $2.04 15 Dec 2024 | −79.3% | 680 | 23 Jan 2024 |
| Polkadot DOT | $1.03 | $53.82 4 Nov 2021 | −98.1% | 1,816 | 18 Aug 2020 |
| LayerZero ZRO | $1.72 | $7.18 6 Dec 2024 | −76.1% | 689 | 21 Jun 2024 |
| Pepe PEPE | $0.00000438 | $0.00002649 9 Dec 2024 | −83.5% | 686 | 6 May 2023 |
| SKY Governance Token SKY | $0.06914 | $0.09775 4 Oct 2026 | −29.3% | 22 | 2 Sep 2024 |
| Arbitrum ARB | $0.1687 | $2.26 11 Jan 2024 | −92.5% | 1,018 | 23 Mar 2023 |
| Falcon Finance FF | $0.1014 | $0.1993 1 Oct 2025 | −49.1% | 390 | 30 Sep 2025 |
| POL (ex-MATIC) POL | $0.09136 | $1.27 13 Mar 2024 | −92.8% | 957 | 25 Oct 2023 |
| Aptos APT | $0.7022 | $18.38 25 Jan 2023 | −96.2% | 1,369 | 19 Oct 2022 |
| Curve DAO CRV | $0.3529 | $6.91 15 Aug 2020 | −94.9% | 2,263 | 15 Aug 2020 |
| Zama ZAMA | $0.07189 | $0.1017 22 Sep 2026 | −29.3% | 34 | 3 Feb 2026 |
| Sentient SENT | $0.02051 | $0.04799 31 Jan 2026 | −57.3% | 268 | 23 Jan 2026 |
| ether.fi ETHFI | $0.6398 | $7.92 27 Mar 2024 | −91.9% | 943 | 19 Mar 2024 |
| Pendle PENDLE | $1.98 | $6.99 10 Apr 2024 | −71.6% | 929 | 29 Mar 2023 |
| Ethereum Name Service ENS | $5.27 | $76.15 28 Nov 2021 | −93.1% | 1,793 | 10 Nov 2021 |
| Fetch.ai FET | $0.1777 | $3.26 28 Mar 2024 | −94.6% | 942 | 5 Oct 2020 |
| Lido DAO LDO | $0.3763 | $3.79 10 Jan 2024 | −90.1% | 1,020 | 10 May 2022 |
| EigenCloud EIGEN | $0.2011 | $5.50 16 Dec 2024 | −96.3% | 679 | 2 Oct 2024 |
| SPX6900 SPX | $0.3804 | $2.15 27 Jul 2025 | −82.3% | 456 | 22 Nov 2024 |
| edgeX EDGE | $0.3355 | $1.51 21 May 2026 | −77.8% | 158 | 1 Apr 2026 |
| Immutable IMX | $0.1415 | $9.33 25 Nov 2021 | −98.5% | 1,796 | 10 Nov 2021 |
| Axie Infinity AXS | $0.96 | $160.38 7 Nov 2021 | −99.4% | 1,814 | 26 Apr 2021 |
| Basic Attention Token BAT | $0.1421 | $1.77 27 Nov 2021 | −91.9% | 1,794 | 9 Jan 2018 |
| The Graph GRT | $0.02245 | $2.34 13 Feb 2021 | −99.0% | 2,081 | 18 Dec 2020 |
| Maple Finance SYRUP | $0.1768 | $0.6255 28 Jun 2025 | −71.7% | 485 | 16 Jan 2025 |
| Floki FLOKI | $0.00002309 | $0.0003205 6 Jun 2024 | −92.8% | 872 | 18 Jan 2022 |
| Compound COMP | $21.08 | $854.27 11 May 2021 | −97.5% | 1,994 | 18 Jun 2020 |
| The Sandbox SAND | $0.04843 | $7.51 28 Nov 2021 | −99.4% | 1,793 | 15 Aug 2020 |
| ApeCoin APE | $0.1245 | $23.71 28 Apr 2022 | −99.5% | 1,642 | 18 Mar 2022 |
| Prom PROM | $5.54 | $24.87 3 Sep 2021 | −77.7% | 1,879 | 28 May 2021 |
| AltLayer ALT | $0.00647 | $0.6654 28 Mar 2024 | −99.0% | 942 | 26 Jan 2024 |
| Gala GALA | $0.001765 | $0.0827 10 Mar 2024 | −97.9% | 960 | 19 Apr 2023 |
| Nillion NIL | $0.0899 | $0.628 25 Mar 2025 | −85.7% | 580 | 25 Mar 2025 |
| Caldera ERA | $0.0867 | $1.46 24 Jul 2025 | −94.1% | 459 | 18 Jul 2025 |
How the figures are calculated
Every figure comes from daily closing prices: the price at 00:00 UTC that ends each UTC day, which is what our price charts publish. The all-time high is the highest of those closes, so a spike within a day does not show; our own intraday price record begins in October 2026, after Bitcoin's current high, so the intraday peak of that day is not in our data. A new all-time high is a close above every earlier close. The drawdown is the close against the highest close up to that day, the same figure as our Price Drawdown from ATH chart; the price now is today's price so far while the UTC day is open, updated every hour.
BTC/USD prices are the site's admitted daily closes: retained retrospective closes from The Bitcoin Time Machine (CC BY 4.0) until 2 October 2026, then quotes recorded by CryptoKeyhole at each UTC day boundary (within 15 minutes of it, never carried forward). Each day's close is the price at its ending boundary, 00:00 UTC the next day. Daily closes start on 17 July 2010; hourly quotes start on 3 October 2026. Four closes of 20 to 25 February 2014, during the collapse of the then-largest exchange, are erratic in the retrospective source: they stay on the charts but never count as a high or a low here, the same rule as our price history pages.
Every other coin uses its own daily price chart on this site, CryptoKeyhole's US-dollar index of public exchange markets, from the first day we have for it. This page is recalculated every ten minutes.
Questions
What is Bitcoin's all-time high?
How far is Bitcoin below its all-time high?
When did Bitcoin last make a new all-time high?
How many all-time highs has Bitcoin made?
How far did Bitcoin fall after past cycle peaks?
Is this the intraday all-time high?
No. Every high on this page is a daily close at 00:00 UTC, the figure our price charts and price history pages use. An intraday peak can be higher than the day's close, and our own intraday price record starts in October 2026, after Bitcoin's current high.
Open the drawdown chartBitcoin price historyCreate free accountAll free tools
Figures on this page are calculated by CryptoKeyhole from our own Bitcoin node and the price data we collect, and refreshed automatically; estimates say how they are made. Nothing here is investment advice.