
Today's checklist
| Indicator | Latest | Top zone | Bottom zone | Now |
|---|---|---|---|---|
| MVRV Z-Score Market value against realized value, in σ. Guide | 0.84 25 Oct 2026 | 7 and above | below 0 | Between |
| MVRV ratio Market value against realized value. Guide | 1.364 25 Oct 2026 | 3.7 and above | below 1 | Between |
| NUPL Unrealized profit as a share of market value. Guide | 0.267 25 Oct 2026 | 0.75 and above | below 0 | Between |
| Puell Multiple Daily issuance value against its yearly average. Guide | 1.122 25 Oct 2026 | 4 and above | below 0.5 | Between |
| Mayer Multiple Price against its 200-day average. Guide | 1.098 25 Oct 2026 | 2.4 and above | below 0.8 | Between |
| 2-year MA multiplier Price against its 2-year average. Guide | 0.90× 25 Oct 2026 | 5× and above | below 1× | Bottom zone since 29 Jan 2026 |
| 200-week moving average Price against its 200-week average. Guide | 1.19× 25 Oct 2026 | 3× and above | below 1× | Between |
| Golden Ratio Multiplier Price against its 350-day average. Guide | 1.05× 25 Oct 2026 | 5× and above | below 1× | Between |
| Power-law position Price among the power-law lines, 0 to 100. Guide | 2.1 today so far | 95 and above | below 5 | Bottom zone since 7 Oct 2026 |
| Rainbow chart Price against its log-regression trend, in σ. Guide | −0.95σ today so far | +2σ and above | below −1σ | Between |
| Pi Cycle Top 111-day average against 2 × the 350-day. Guide | 51.4% below 25 Oct 2026 | Lines crossed | – | Not crossed |
| Pi Cycle Bottom 150-day EMA against 0.745 × the 471-day. Guide | 19.0% above 25 Oct 2026 | – | Lines crossed | Not crossed |
| Reserve Risk Price against holders' opportunity cost. Guide | 0.00127 25 Oct 2026 | No fixed level | No fixed level | Below its 4-year middle |
- Pi Cycle Top: The 111-day average ($74,282) would have to rise 105.6% to reach twice the 350-day average ($152,716). Its zone is the 111-day average closing at or above twice the 350-day average.
- Pi Cycle Bottom: The 150-day EMA ($76,260) is 19.0% above 0.745 × the 471-day average ($64,100). Its zone is the 150-day EMA closing below 0.745 × the 471-day average.
- Reserve Risk has no fixed thresholds, so it is shown but not counted: its zone places the reading among its own last four years (below the middle of its last four years).
- MVRV Z-Score, MVRV, NUPL, the Puell Multiple and Reserve Risk are classics a free account opens in full; signed out, their pages state today's value and zone, as here.
Price levels for each zone
Bitcoin is at $80,207 today so far (26 October 2026, data through 15:00 UTC). For the indicators built on a price line, these are the prices at which each would be in a zone, at today's lines. The lines move every day, so the levels do too; they are a reading of today, not a target.
| Indicator | Bottom zone: a close below | Top zone: a close at or above | Line used |
|---|---|---|---|
| MVRV ratio | $58,712 | $217,235 | The realized price ($58,712, today so far) |
| NUPL | $58,712 | $234,848 | The realized price ($58,712, today so far) |
| Mayer Multiple | $58,358 | $175,074 | The 200-day average ($72,947, 25 Oct 2026) |
| 2-year MA multiplier | $89,296 | $446,480 | The 2-year average ($89,296, 25 Oct 2026) |
| 200-week moving average | $67,072 | $201,216 | The 200-week average ($67,072, 25 Oct 2026) |
| Golden Ratio Multiplier | $76,358 | $381,791 | The 350-day average ($76,358, 25 Oct 2026) |
| Power-law position | $86,090 | $308,155 | The power-law 5% and 95% lines (today so far) |
| Rainbow chart | $77,552 | $634,076 | The regression's −1σ and +2σ lines (today so far) |
When each last reached its zones
| Indicator | Last day in the top zone | Last day in the bottom zone | Daily record from |
|---|---|---|---|
| MVRV Z-Score | With a free account | With a free account | – |
| MVRV ratio | With a free account | With a free account | – |
| NUPL | With a free account | With a free account | – |
| Puell Multiple | With a free account | With a free account | – |
| Mayer Multiple | 13 Mar 2021 23 stretches | 1 Jul 2026 52 stretches | 1 Feb 2011 |
| 2-year MA multiplier | 15 Jan 2018 10 stretches | Now since 29 Jan 2026 | 15 Jul 2012 |
| 200-week moving average | 2 Dec 2021 18 stretches | 16 Aug 2026 26 stretches | 16 May 2014 |
| Golden Ratio Multiplier | 18 Dec 2017 10 stretches | 17 Sep 2026 36 stretches | 1 Jul 2011 |
| Power-law position | 15 Nov 2021 13 stretches | Now since 7 Oct 2026 | 17 Jul 2010 |
| Rainbow chart | 15 Jan 2018 9 stretches | 20 Aug 2026 47 stretches | 17 Jul 2010 |
| Pi Cycle Top | 22 Apr 2021 5 stretches | – | 1 Jul 2011 |
| Pi Cycle Bottom | – | 15 Mar 2023 3 stretches | 30 Oct 2011 |
Closed UTC days from each chart's published daily record; a stretch is a run of consecutive days in the zone. The classics' full daily history opens with a free account; signed out their charts show a fixed 2019–2022 sample.
The Cycle Composite Score
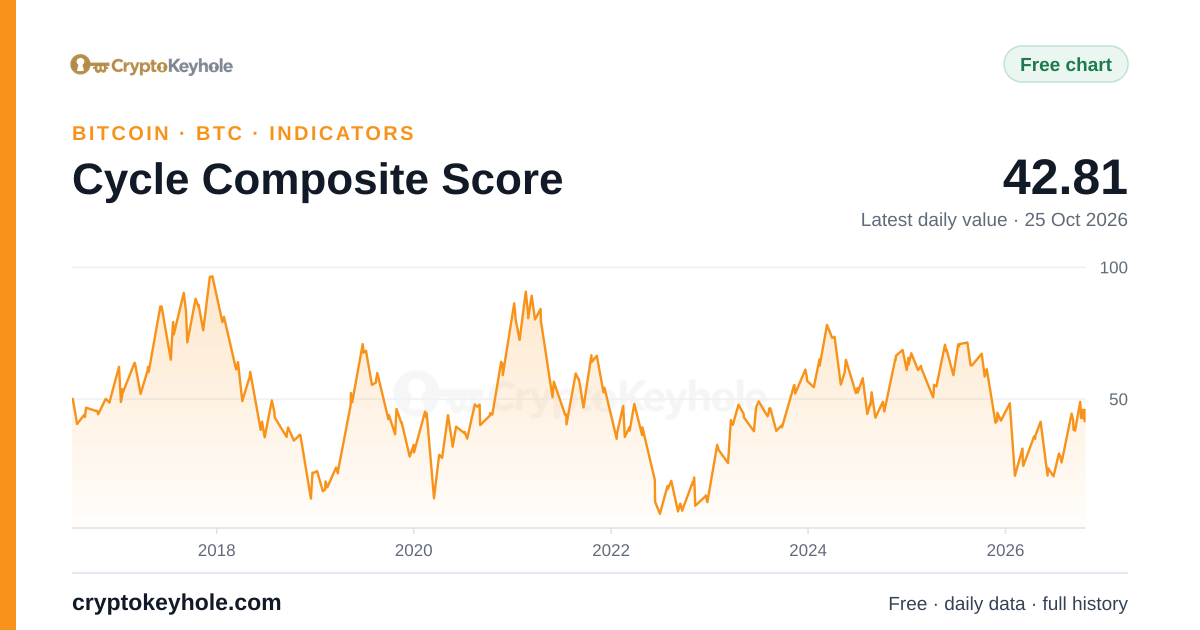
The headline score combines seven of these indicators into one number from 0 to 100: MVRV Z-Score, NUPL, Reserve Risk, the Puell Multiple, the Mayer Multiple, the 2-year MA multiplier and the Pi Cycle Top ratio. Each is scored against its own last four years, so their different scales and their shrinking extremes from one cycle to the next do not decide the reading on their own; around 50 they sit near their four-year averages. Its guide explains the method: Bitcoin cycle indicator.
- Latest: 43 of 100 (neutral), 25 Oct 2026; a week earlier (18 Oct 2026) it read 45.
- 35.7% of daily readings since 14 July 2016 were lower.
- Readings of 80 or more came in 13 stretches; the most recent ended on 15 April 2021.
- Readings below 20 came in 16 stretches; the most recent ended on 11 January 2023.
Cycle Composite Score
More cycle indicators with Plus
These cycle charts are calculated from the same node and price data. Their current readings and zones come with Plus; signed out, each chart shows a fixed 2019–2022 sample.
- RHODL Ratio: one-week against one-to-two-year realized value; high at past cycle tops (guide).
- Stock-to-Flow Deflection: price against the stock-to-flow model price (guide).
- Pi Cycle Top Projection: the price that would make the Pi Cycle Top lines cross within 30, 60 or 90 days (guide).
- Hash Ribbon: the 30-day against the 60-day hash rate: miner capitulation and recovery (guide).
- CVDD: a model price that past cycle lows touched (guide).
- Market Cap to Thermocap Ratio: market value against everything ever paid to miners.
- LTH-MVRV: MVRV of coins held 155 days or more.
- STH-MVRV: MVRV of coins moved in the last 155 days.
- Adjusted NUPL: NUPL without coins unmoved for seven years or more.
Sources and method
Every reading comes from a chart this site publishes, calculated from our own Bitcoin node and the BTC/USD price record, and read as a signed-out visitor sees it: Free charts in full, and the classics a free account opens (MVRV Z-Score, MVRV, NUPL, the Puell Multiple, the realized price and Reserve Risk) by today's value and zone only. Readings are daily closes at 00:00 UTC; the power-law position and the logarithmic regression also publish today's partial reading, updated every hour, and the checklist shows it labelled "today so far". This page is rebuilt every ten minutes.
The thresholds are the long-standing reference levels for each indicator, the ones our guides use to name their zones (each row links its guide). Past cycle tops and bottoms reached them at different depths, and some cycles never touched a zone at all: they mark where past turning points formed, not a forecast of the next one. For the 200-week moving average and the Golden Ratio Multiplier the top zone is their guides' highest band, three and five times the average.
Several indicators share inputs: MVRV, NUPL and MVRV Z-Score all set market value against realized value; six others compare the price with moving averages of its own daily closes, and two with long-run trends fitted to them, so they tend to enter their zones together. The tally above is a count, not a weighted score; the Cycle Composite Score is the summary. Price levels are today's lines multiplied by each threshold and move every day. The last day in a zone is read from each chart's full daily record; for the classics that record opens with a free account. Charts above Free are linked, never quoted.
Questions
How many Bitcoin cycle top indicators are flashing today?
Are any indicators in their bottom zone?
Has the Pi Cycle Top crossed this cycle?
Which indicators are best at spotting a Bitcoin cycle top?
Where do the top and bottom thresholds come from?
They are the long-standing reference levels for each indicator, the same ones our guides use to name their zones; each row links its guide. They describe where past tops and bottoms formed. They are not a model of the future, and a reading in a zone is not a signal to buy or sell.
How often is this page updated?
Every ten minutes. Most indicators are daily: they change once a day, after the 00:00 UTC close. The power-law position and the logarithmic regression also show today's partial reading, updated every hour.
Open the Cycle Composite Score chartCreate free accountAll free tools
Figures on this page are calculated by CryptoKeyhole from our own Bitcoin node and the price data we collect, and refreshed automatically; estimates say how they are made. Nothing here is investment advice.