
Recent moves and averages
| Over the last | ETH/BTC then | ETH/BTC change | ETH in USD | BTC in USD |
|---|---|---|---|---|
| 24 hours | 0.02906 25 Oct 2026 | −0.4% | −0.7% | −0.3% |
| 7 days | 0.02930 19 Oct 2026 | −1.2% | −3.5% | −2.3% |
| 30 days | 0.03200 26 Sep 2026 | −9.6% | −13.4% | −4.3% |
| 90 days | 0.02979 28 Jul 2026 | −2.8% | +23.2% | +26.8% |
| 365 days | 0.03581 26 Oct 2025 | −19.2% | −42.8% | −29.2% |
ETH/BTC (daily close)50-day average200-day average
- The ratio is 6.9% below its 50-day average (0.03109) and 1.7% below its 200-day average (0.02945), both taken over daily closes to 25 Oct 2026.
- It has closed below its 200-day average every day since 21 October 2026 (5 days).
- The 50-day average has been above the 200-day average since 18 August 2026.
- Over the past 365 days the ratio closed as high as 0.03630 (26 Oct 2025) and as low as 0.02578 (6 Jun 2026).
Highs and lows
- Highest close: 0.14963 on 12 June 2017. The ratio is 80.7% below it now and would have to rise 417.0% to reach it again.
- Lowest close: 0.00160 on 20 October 2015, in ether's first months of trading. The lowest close of the past five years was 0.01805 on 21 April 2025; the ratio is 1.6 times that now.
- 4,098 daily closes since 7 August 2015.
| Year | Open | High | Low | Close | Change |
|---|---|---|---|---|---|
| 2026 so far | 0.03396 | 0.03518 6 Jan 2026 | 0.02578 6 Jun 2026 | 0.02894 now | −14.8% |
| 2025 | 0.03575 | 0.04212 24 Aug 2025 | 0.01805 21 Apr 2025 | 0.03396 | −5.0% |
| 2024 | 0.05397 | 0.06017 25 Feb 2024 | 0.03256 20 Nov 2024 | 0.03575 | −33.7% |
| 2023 | 0.07225 | 0.07743 11 Jan 2023 | 0.05043 20 Dec 2023 | 0.05397 | −25.3% |
| 2022 | 0.07954 | 0.08465 8 Sep 2022 | 0.05237 16 Jun 2022 | 0.07225 | −9.2% |
| 2021 | 0.02545 | 0.08791 8 Dec 2021 | 0.02407 2 Jan 2021 | 0.07954 | +212.6% |
| 2020 | 0.01788 | 0.03988 1 Sep 2020 | 0.01747 8 Jan 2020 | 0.02545 | +42.3% |
| 2019 | 0.03550 | 0.04175 5 Jan 2019 | 0.01642 6 Sep 2019 | 0.01788 | −49.6% |
| 2018 | 0.05351 | 0.11273 1 Feb 2018 | 0.02594 6 Dec 2018 | 0.03550 | −33.7% |
| 2017 | 0.00844 | 0.14963 12 Jun 2017 | 0.00819 1 Jan 2017 | 0.05351 | +533.8% |
| 2016 | 0.00218 | 0.03500 13 Mar 2016 | 0.00207 7 Jan 2016 | 0.00844 | +287.3% |
| 2015 from 7 Aug | 0.00990 | 0.00990 7 Aug 2015 | 0.00160 20 Oct 2015 | 0.00218 | – |
ETH against BTC in each cycle
| Phase | ETH/BTC | ETH/BTC change | ETH in USD | BTC in USD | Highest ETH/BTC |
|---|---|---|---|---|---|
| Rise to Dec 2017 7 Aug 2015 – 16 Dec 2017 | 0.00990 → 0.03663 | +270.0% | +25,265% | +6,756% | 0.14963 12 Jun 2017 |
| Fall to Dec 2018 16 Dec 2017 – 15 Dec 2018 | 0.03663 → 0.02670 | −27.1% | −87.8% | −83.3% | 0.11273 1 Feb 2018 |
| Rise to Nov 2021 15 Dec 2018 – 8 Nov 2021 | 0.02670 → 0.07120 | +166.7% | +5,508% | +2,002% | 0.08176 14 May 2021 |
| Fall to Nov 2022 8 Nov 2021 – 21 Nov 2022 | 0.07120 → 0.07008 | −1.6% | −77.0% | −76.6% | 0.08791 8 Dec 2021 |
| Rise to Oct 2025 21 Nov 2022 – 6 Oct 2025 | 0.07008 → 0.03757 | −46.4% | +323.5% | +690.0% | 0.07743 11 Jan 2023 |
| Since Oct 2025 6 Oct 2025 – now | 0.03757 → 0.02894 | −23.0% | −50.3% | −35.5% | 0.03757 6 Oct 2025 |
- Ether gained on bitcoin in 2 of the 5 completed phases since 2015, those ending at the December 2017 peak (+270.0%) and the November 2021 peak (+166.7%).
- Rises: to the December 2017 peak, ETH +25,265% and BTC +6,756%; to the November 2021 peak, ETH +5,508% and BTC +2,002%; to the October 2025 peak, ETH +323.5% and BTC +690.0%.
- Falls: to the December 2018 low, ETH −87.8% and BTC −83.3%; to the November 2022 low, ETH −77.0% and BTC −76.6%.
- Since the October 2025 peak: ETH/BTC −23.0%, ETH −50.3%, BTC −35.5%.
Phases run between the dates of Bitcoin's cycle peaks and lows as our all-time high page sets them: a cycle peak is an all-time-high close followed by a fall of at least 75% before a higher close, and its low is the lowest close before that higher close. The first rise starts at our first ETH close, on 7 August 2015, after the January 2015 low. Prices and ratios are daily closes of our own indexes on those dates.
How the ratio is calculated
ETH/BTC is the price of one ether in bitcoin. We calculate it from our own hourly price indexes for ETH and BTC in US dollars: each hour, the ETH close divided by the BTC close. A day's close is the ratio at the end of its last hour, 00:00 UTC; the latest point is the most recent hour both indexes have reached, so the open day reads as today so far until it closes.
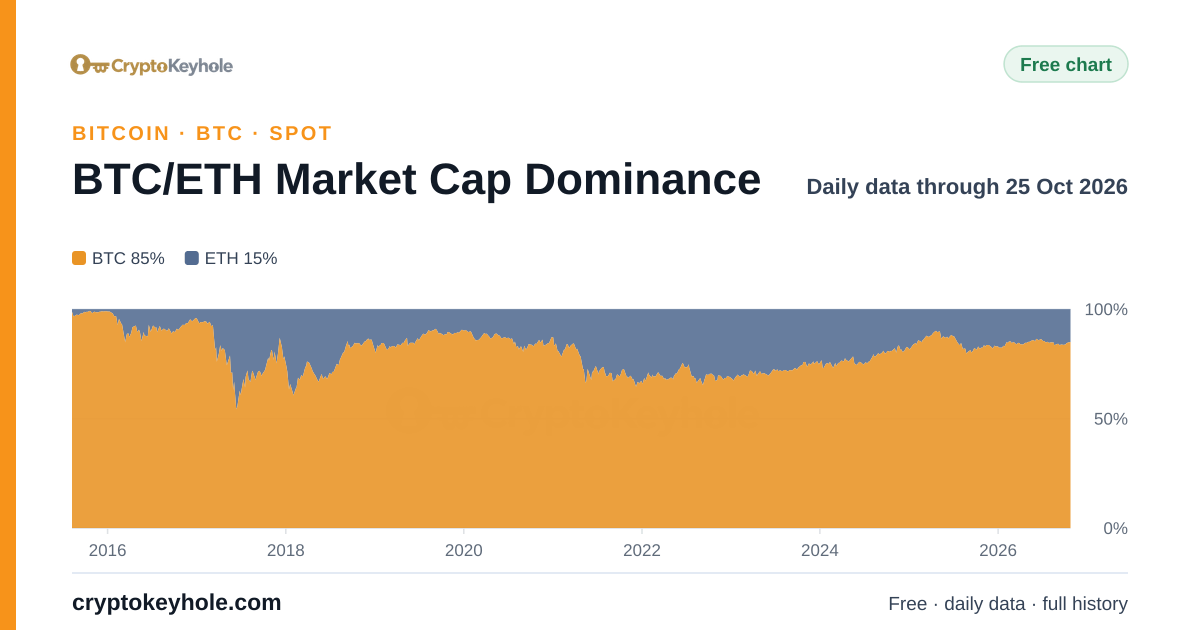
Each index close is the volume-weighted median of the hourly closing prices of the exchange markets it uses, currently Binance, Bitfinex, Bitstamp, Coinbase and Kraken, with USDT and USDC prices taken at face value. In ether's first months, to May 2016, its index also counts ETH/BTC markets, converted at our BTC index for the same hour. ETH's index is the price on our ETH charts; BTC's index is the one behind our BTC/ETH market cap dominance chart. Our main BTC/USD price for Bitcoin's own charts is recorded at each day boundary in a different way and can differ from this index by a fraction of a percent, so the ratio here always uses the two indexes built the same way.
Highs, lows and the 50- and 200-day averages use daily closes (simple averages of the last 50 and 200 closes), not intraday prices. Moves compare the latest hour with the same hour 1, 7, 30, 90 and 365 days earlier. Free to reuse under CC BY 4.0, crediting CryptoKeyhole with a link to this page.
Questions
What is the ETH/BTC ratio today?
What is the highest ETH/BTC has been?
What is the lowest ETH/BTC has been?
What are the 50-day and 200-day averages of ETH/BTC?
Why do traders watch ETH/BTC?
It prices ether in bitcoin rather than in dollars, so it shows whether money is moving towards the largest altcoin or towards bitcoin. A rising ratio has usually come with stronger altcoin markets, and a falling one with bitcoin leading. It says nothing on its own about whether either coin is rising in dollars.
How is the ratio calculated here?
Our hourly ETH/USD index divided by our hourly BTC/USD index for the same hour. Both indexes are volume-weighted medians of the hourly closing prices on the exchanges we read, so the ratio follows the price of ether in bitcoin closely without depending on any single exchange. A daily close is the ratio at 00:00 UTC.
Open the BTC/ETH dominance chartETH price chartCreate a free accountAll free tools
Ratios are calculated by CryptoKeyhole from our own hourly ETH and BTC price indexes and refreshed automatically. Nothing here is investment advice.