
Hyperliquid ETF flows
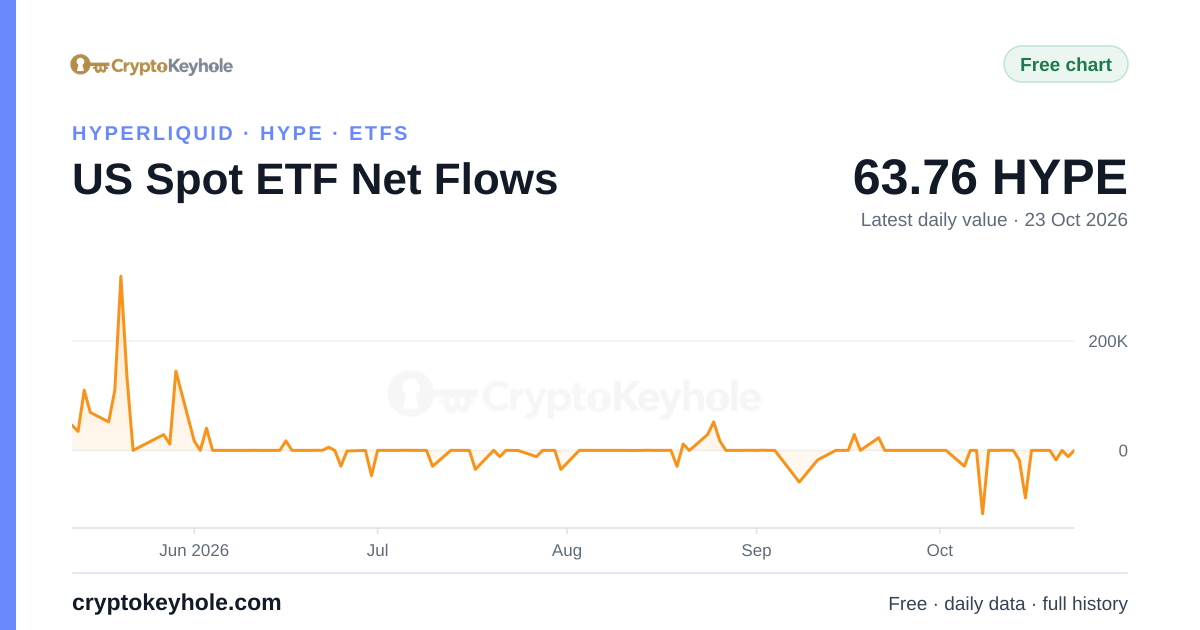
Daily net inflows and outflows of the US spot Hyperliquid ETFs, fund by fund, from each issuer's own published holdings file: 2 funds collected daily, in HYPE and US dollars, with holdings, each fund's share and the cumulative flow since each fund's first day here. Free, no account needed.
- Net flow, 23 Oct 2026+64 HYPE+$5KAll 2 funds included reported
- Last 5 complete trading days-28,814 HYPE19 Oct to 23 Oct 2026
- Held by the funds collected daily2,699,468 HYPE2 funds · 23 Oct 2026
- Latest issuer file23 Oct 2026dated by the issuer · read 26 Oct 2026, 12:12 UTC
Daily Hyperliquid ETF flows by fund
Newest day first. Each cell is the fund's change in HYPE held from the previous US trading day (creations minus redemptions, plus staking rewards a staking fund keeps, less the coins it sells for its fee or a cash payout); US$ values are those coins at our own HYPE/USD close for that UTC day. … the issuer has not published that day yet; new first day collected (no flow); n/a missing from the issuer's own history; · not included that day. A total marked with a count such as 5/7 is partial.
| Day | BHYP | THYP | Total |
|---|---|---|---|
| 23 Oct 2026 | new | +5 | +5 |
| 22 Oct 2026 | · | -896 | -896 |
| 21 Oct 2026 | · | 0 | 0 |
| 20 Oct 2026 | · | -1,397 | -1,397 |
| 19 Oct 2026 | · | +4 | +4 |
| 16 Oct 2026 | · | +1 | +1 |
| 15 Oct 2026 | · | -7,091 | -7,091 |
| 14 Oct 2026 | · | -1,406 | -1,406 |
| 13 Oct 2026 | · | 0 | 0 |
| 12 Oct 2026 | · | +12 | +12 |
| 9 Oct 2026 | · | +3 | +3 |
| 8 Oct 2026 | · | -9,743 | -9,743 |
| 7 Oct 2026 | · | +7 | +7 |
| 6 Oct 2026 | · | +5 | +5 |
| 5 Oct 2026 | · | -2,710 | -2,710 |
| 2 Oct 2026 | · | +2 | +2 |
| 1 Oct 2026 | · | -4 | -4 |
| 30 Sep 2026 | · | +7 | +7 |
| 29 Sep 2026 | · | new | new |
| 28 Sep 2026 | · | n/a | n/a |
| 25 Sep 2026 | · | +4 | +4 |
| 24 Sep 2026 | · | +6 | +6 |
| 23 Sep 2026 | · | -3 | -3 |
| 22 Sep 2026 | · | +5 | +5 |
| 21 Sep 2026 | · | +2,193 | +2,193 |
| 18 Sep 2026 | · | +3 | +3 |
| 17 Sep 2026 | · | +2,473 | +2,473 |
| 16 Sep 2026 | · | -1 | -1 |
| 15 Sep 2026 | · | +1 | +1 |
| 14 Sep 2026 | · | +13 | +13 |
| Day | BHYP | THYP | Total |
|---|---|---|---|
| 23 Oct 2026 | new | +64 | +64 |
| 22 Oct 2026 | · | -11,563 | -11,563 |
| 21 Oct 2026 | · | 0 | 0 |
| 20 Oct 2026 | · | -17,371 | -17,371 |
| 19 Oct 2026 | · | +57 | +57 |
| 16 Oct 2026 | · | +15 | +15 |
| 15 Oct 2026 | · | -86,699 | -86,699 |
| 14 Oct 2026 | · | -17,382 | -17,382 |
| 13 Oct 2026 | · | +2 | +2 |
| 12 Oct 2026 | · | +145 | +145 |
| 9 Oct 2026 | · | +39 | +39 |
| 8 Oct 2026 | · | -115,729 | -115,729 |
| 7 Oct 2026 | · | +83 | +83 |
| 6 Oct 2026 | · | +52 | +52 |
| 5 Oct 2026 | · | -28,774 | -28,774 |
| 2 Oct 2026 | · | +23 | +23 |
| 1 Oct 2026 | · | -45 | -45 |
| 30 Sep 2026 | · | +73 | +73 |
| 29 Sep 2026 | · | new | new |
| 28 Sep 2026 | · | n/a | n/a |
| 25 Sep 2026 | · | +45 | +45 |
| 24 Sep 2026 | · | +69 | +69 |
| 23 Sep 2026 | · | -30 | -30 |
| 22 Sep 2026 | · | +55 | +55 |
| 21 Sep 2026 | · | +23,309 | +23,309 |
| 18 Sep 2026 | · | +34 | +34 |
| 17 Sep 2026 | · | +29,064 | +29,064 |
| 16 Sep 2026 | · | -16 | -16 |
| 15 Sep 2026 | · | +16 | +16 |
| 14 Sep 2026 | · | +159 | +159 |
Cumulative and daily net flows
Interactive charts, by fund, every day collected: flows by fund, net flows, holdings by fund.
Holdings and share by fund
Each fund on its latest day. Share is of the funds collected daily on 23 October 2026. Flows over 5 and 30 trading days are shown only when the fund was collected on all of them.
| Fund | HYPE held | Share | Latest day | 5 days | 30 days | Daily data from | Latest issuer file |
|---|---|---|---|---|---|---|---|
| BHYPBitwise Hyperliquid ETF | 1,953,07723 Oct 2026 | 72.4% | – | – | – | 23 Oct 2026 (first collected) | issuer stamp 26 Oct 2026, 16:30 UTC |
| THYP21Shares Hyperliquid Staking ETF | 746,39123 Oct 2026 | 27.6% | +64 | -28,814 | – | 12 May 2026 (launch) | issuer stamp 26 Oct 2026, 16:00 UTC |
| HYPGGrayscale Hyperliquid Staking ETF | 1,941,39530 Jun 2026, 10-Q | Not collected daily: its sites answer automated readers with a bot challenge, and we do not work around that. Its holdings here are its latest quarter-end figure from its SEC filing. | quarterly, SEC filings | ||||
Which funds, and when they publish
Collected daily from each issuer's own published holdings file:
- Bitwise (BHYP): publishes only the current day, so its daily record here starts on 23 October 2026.
- 21Shares (THYP): publishes every day since launch.
Not collected daily: Grayscale Hyperliquid Staking ETF (HYPG). Their issuers' sites refuse automated reads and we do not work around that; their holdings appear above from their quarterly SEC filings where we have them, and they are not in the daily totals or flows.
The funds publish after the US market closes at 4 p.m. New York time, each at its own time, many the next morning. We read every issuer that has not yet published the latest trading day every 5 minutes, so a new file is here within about 5 minutes of its publication; a day is complete once every fund collected daily has published it. Issuers' files last checked 26 Oct 2026, 16:52 UTC.
How the figures are made
A fund's HYPE on a day is the figure its issuer's own file states for that day (for THYP, which state no coin count in their daily history, the fund's net assets divided by the HYPE price it used for that day, both from the same file: the coins backing the shares, net of accrued fees and other payables). Its flow is the change from the previous US trading day. A day's total and net flow are shown only when every fund collected daily has published it; a fund collected from a later day joins without a flow, so the totals step up on that day without counting a flow. Nothing is filled in, carried forward or estimated.
Every file is checked before use: coins against shares times coins per share, NAV times shares against net assets, and net assets divided by the price against the coins, wherever the file states them, each within 0.05% plus the rounding of the stated digits; a day whose figures disagree is left out. At each quarter end the daily figures are compared with the funds' own 10-Q and 10-K filings, wherever a filing states the coins in a form we can read and the daily series covers the quarter end: 1 of 1 fund quarters agree within 0.05%, the largest difference 0.006%. The funds collected from October 2026 have their first quarter end here on 31 December 2026.
Funds that stake (BHYP and THYP) count their staked HYPE in their holdings: rewards a fund keeps add to its holdings without a creation, and a fund that pays its rewards out in cash sells HYPE to do so, which shows here as an outflow.
US dollar values are the coins times our own HYPE/USD close for that UTC day (our exchange index), so they can differ slightly from figures based on each fund's NAV.
Questions
What are Hyperliquid ETF flows?
The HYPE a US spot Hyperliquid ETF takes in or pays out in a day: creations add HYPE, redemptions remove it. We measure each fund's flow as the change in the HYPE it holds from one US trading day to the next, from the issuer's own daily file.
Why is the latest day marked partial?
Each issuer publishes its daily holdings file after the US close at its own time, many the next morning. Until every fund collected daily has published, the day shows the funds that have, names the ones still to come and gives no complete total.
Which Hyperliquid ETFs are included?
Every US spot Hyperliquid ETF whose issuer publishes a daily holdings file we can read: Bitwise (BHYP) and 21Shares (THYP). Grayscale (HYPG) refuses automated reads, so it is shown from its quarterly SEC filings where filed, not in the daily figures.
Why does the daily record start on 23 October 2026?
Most of these issuers publish only the current day's holdings, so a fund's daily record here starts on the first day we read its file and nothing before it is filled in. 21Shares (THYP) publish their daily net assets and price since launch, so it is included from its first day.
Do staking funds count staked HYPE?
Yes. Funds that stake (BHYP and THYP) count their staked HYPE in their holdings, so rewards they keep add to their holdings without a creation; a fund that pays its rewards out in cash sells HYPE to do so.
How often is the page updated?
Every 5 minutes while any issuer has not yet published the latest trading day, and every 30 minutes otherwise; the page shows when the issuers' files were last checked.
Open the interactive chartCreate a free accountSet an alert
Figures are calculated by CryptoKeyhole from the ETF issuers' own published files and our own price and node data. Nothing here is investment advice.