
Block times
Block times to block 973,442
| Measured over | Average block time | Against 10 minutes | Blocks per day |
|---|---|---|---|
| Last 6 blocks | 7.83 min | 21.7% faster | 183.9 |
| Last 144 blocks | 8.44 min | 15.6% faster | 170.7 |
| Last 1,008 blocks | 9.25 min | 7.5% faster | 155.7 |
| Last 2,016 blocks | 9.36 min | 6.4% faster | 153.8 |
| This difficulty epoch | 9.36 min | 6.4% faster | 153.9 |
- Longest gap in the last 2,016 blocks: 68.68 min, before block 973,263; 5 gaps of an hour or more.
- Daily mean on 26 Oct 2026: 8.95 min; daily median 6.78 min. Block discovery is random, so most gaps are shorter than the mean and a few are much longer.
Daily mean (seconds)30-day average
Times are the block headers' timestamps, which miners set and which may run up to about two hours off the true time, so single gaps can even be negative; averages over many blocks are reliable.
Hash rate and difficulty
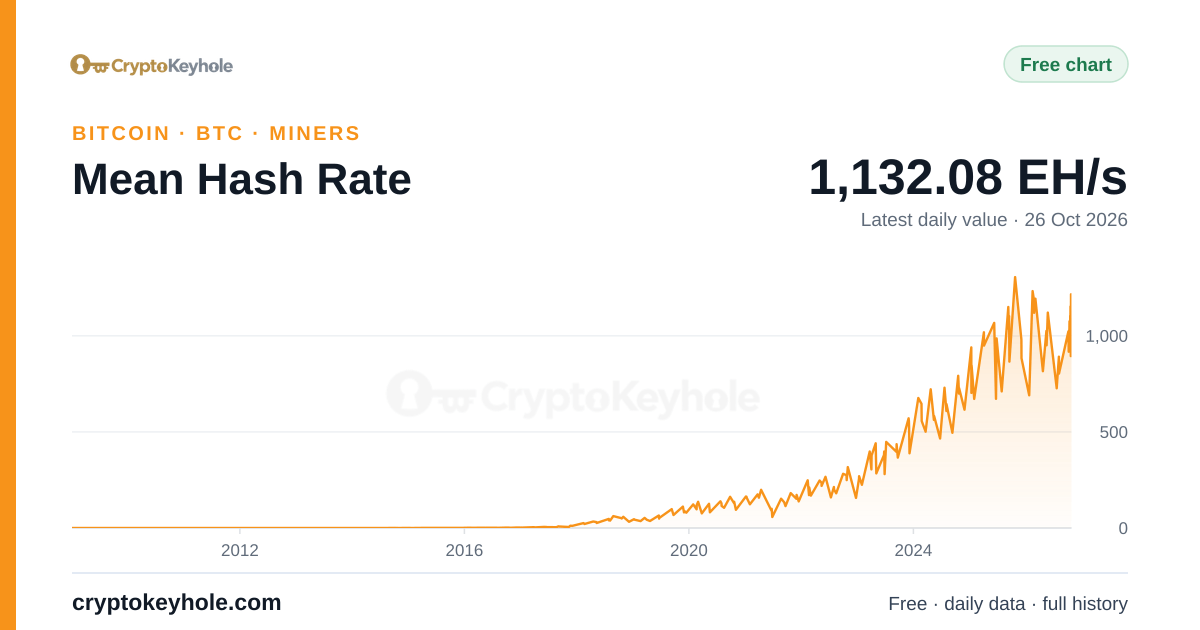
- Daily estimate on 26 Oct 2026: 1,132.1 EH/s; 7-day average 1,080.2 EH/s. Highest day in the past year: 1,241.4 EH/s on 26 Nov 2025.
- Difficulty now: 140.58 trillion, set at block 971,712 on 16 Oct 2026. A block takes about 603.78 sextillion hashes on average.
- Next adjustment at block 973,728 (286 blocks left): estimated +6.9% around 29 Oct 2026 (range +3.9% to +8.0%). Live estimate and every past adjustment: next difficulty adjustment.
Hash rate implied by recent blocks
| Measured over | Hash rate |
|---|---|
| Last 144 blocks | 1,192.6 EH/s |
| Last 1,008 blocks | 1,088.3 EH/s |
| Last 2,016 blocks | 1,066.4 EH/s |
Daily (EH/s)30-day average
Hash rate cannot be observed directly. Each block needs on average its difficulty times 232 hashes, so the work of a run of blocks divided by the time they took estimates the hashes per second. Short windows swing widely because blocks are found at random.
Mempool and fees
Next block
2.01 sat/vB
if a block were found now
Within 3 blocks
1.07 sat/vB
about 30 minutes
Within 6 blocks
0.12 sat/vB
about 1 hour
Within 144 blocks
0.11 sat/vB
about 1 day
- 45,058 transactions are waiting in our node's mempool, 14.95 MvB: about 15.0 blocks' worth. The lowest fee rate it accepts now is 0.1 sat/vB.
- Pending fees: 0.0836 BTC. The mempool uses 93 MB of the 300 MB our node allows it.
- The last 144 blocks (to 973,442) were 96.0% full by weight on average, and 1 was empty.
The next-block rate comes from our node's mempool, captured 2 min ago at block 973,442; the others are Bitcoin Core's economical estimates. What a transaction costs at each speed: Bitcoin fee estimator.
Stale blocks and reorganisations
- 2 stale blocks in the 30 days to 26 Oct 2026, 0.4 per 1,000 blocks found.
- 12 stale blocks since our node finished its initial sync on 3 Apr 2026; the latest on 14 Oct 2026.
Days with a stale block, latest first
| UTC day | Stale blocks | Blocks mined |
|---|---|---|
| 14 Oct 2026 | 1 | 161 |
| 4 Oct 2026 | 1 | 143 |
| 15 Sep 2026 | 1 | 163 |
| 26 Aug 2026 | 1 | 152 |
| 16 Aug 2026 | 1 | 161 |
| 8 Aug 2026 | 2 | 143 |
| 2 Aug 2026 | 1 | 144 |
| 26 May 2026 | 1 | 139 |
A stale block is a valid block that lost a race: another block at the same height became part of the chain everyone builds on, and the losing pool's reward vanished. Our node counts every such block it holds or saw, so the figure is a lower bound for the whole network. Frequent stale blocks would point to slow block propagation. Stale blocks chart.
Empty blocks
- 9 empty blocks in the 30 days to 26 Oct 2026, 0.20% of the 4,554 blocks mined.
- 95 empty blocks in the past 365 days; the latest day with one was 23 Oct 2026.
An empty block carries only its coinbase transaction. Pools sometimes mine one right after a new block arrives, before they have checked which transactions the new block spent; it earns the subsidy but leaves waiting transactions behind. Empty blocks chart.
Mining-pool concentration
- Over the 30 days to 26 Oct 2026, the largest pool of each day mined 26.7% of its blocks on average, the three largest 63.3% and the five largest 79.9%.
- On 26 Oct 2026, 3 pools as tagged mined more than half of the day's blocks (2 counting the AntPool group as one).
- Concentration index (HHI, 0 to 10,000), 30-day average: 1,650 for pools as tagged, 2,255 with the AntPool group combined.
Largest poolLargest threeLargest five
Pools are organisations, identified from the tags they write into their blocks' coinbase. The AntPool group combines pools that share its infrastructure. A pool is not a single miner: its hash rate comes from many independent miners who can switch pools. More: the mining pools guide.
Nodes and software
- Reachable nodes in our IPv4 sample: 3,437 on average on 26 Oct 2026, 96.9% of them at the chain tip.
- Our own node, which every figure on this page comes from, runs Bitcoin Core 31.1.0: a full node keeping every block since 2009 (888 GB), fully synced to block 973,442.
Soft-fork signalling and block versions
| Share of blocks | 26 Oct 2026 | 30-day average | |
|---|---|---|---|
| Blocks that signalled for a soft-fork deployment (BIP 9 version bits) | 0.0% | 0.0% | Chart |
| Blocks that used version rolling (BIP 320) | 95.1% | 96.0% | Chart |
| Blocks that met BIP 54's coinbase rule | 37.0% | 40.7% | Chart |
Reachable nodes are a sample: the nodes our crawler reached over IPv4 that accept incoming connections, re-contacted twice an hour. Most nodes accept none, and nodes reachable only over Tor, I2P or IPv6 are not counted, so the true number of nodes is larger. Software names and versions are self-reported.
More detail with a plan
With Plus: Reachable nodes by node software, Reachable nodes by software version, Stale blocks by mining pool, Empty blocks by mining pool, Miner capitulation risk.
Breakdowns by pool and by node software, hourly data and alerts come with a plan.
Compare plansHow it is measured
Everything here is measured by CryptoKeyhole from its own Bitcoin node: block headers for block times, hash rate and difficulty; the node's mempool and fee estimator; every block's transactions for empty blocks and pool tags; the node's own record of competing blocks for stale blocks; and our crawler's handshakes with reachable nodes. The daily figures come from the charts linked in each section, open to everyone, at each UTC day's close; the block windows and the mempool are read live, with every new block and at least once a minute.
The difficulty estimate applies Bitcoin Core's own retarget rule to the epoch so far, as on our difficulty adjustment page. Hash rate is the expected work of recent blocks over the time they took. Nothing on the page is a forecast. Free to reuse under CC BY 4.0, crediting CryptoKeyhole with a link to this page.
Questions
Is the Bitcoin network healthy right now?
How fast are Bitcoin blocks coming?
What is Bitcoin's hash rate today?
What is a stale block?
A valid block that lost a race: two miners found a block at the same height, and the network went on building on the other one. The losing block's reward is lost. A few a month is normal; many would suggest blocks are spreading slowly between miners.
Why are some Bitcoin blocks empty?
Right after a new block arrives, a pool may start mining on top of it before it has worked out which transactions that block already included. If it finds a block in those seconds, it carries only the coinbase. It is legal and earns the subsidy, but it confirms nothing.
How concentrated is Bitcoin mining?
Open the hash rate chartBlock interval chartCreate a free accountAll free tools
Figures are calculated by CryptoKeyhole from our own Bitcoin node and refreshed automatically; estimates say how they are made. Nothing here is investment advice.