
Every level today
| Level | Level on 1 Nov 2026 | BTC now against it | Daily closes |
|---|---|---|---|
| Power-law median line the trend line of the power-law fit | $151,763 | 48.9% below | – |
| Power-law 5% line the line 5% of all daily closes since 2010 sit below | $86,563 | 10.4% below | – |
| BTC now | $77,549 | 16:00 UTC | – |
| 1-year average the simple average of the last 365 daily closes | $77,020 | 0.7% above | closed above it 45 days in a row |
| 21-week exponential average the upper or lower edge of the bull market support band | $76,536 | 1.3% above | closed above it 75 days in a row |
| Power-law 1% line the line only 1% of all daily closes since 2010 sit below | $74,591 | 4.0% above | – |
| 200-day average the simple average of the last 200 daily closes, the line the Mayer Multiple divides by | $73,152 | 6.0% above | closed above it 75 days in a row |
| 20-week simple average the other edge of the bull market support band | $72,632 | 6.8% above | closed above it 75 days in a row |
| 200-week average the simple average of the last 1,400 daily closes, about four years | $67,384 | 15.1% above | closed above it 77 days in a row |
| Pi Cycle Bottom line the 471-day average of daily closes times 0.745 | $63,661 | 21.8% above | closed above it 75 days in a row |
| Realized price the average price at which every bitcoin last moved on chain (its cost basis), from our own node | $58,658 | 32.2% above | – |
How often the price closed below each average
| Level | Closes below it | Last close below it | Longest run below | Deepest close below |
|---|---|---|---|---|
| 1-year average | 32.8% of 5,588 since 2011 | 17 Sep 2026 | 429 days from 14 Aug 2014 | 66.9% 14 Jan 2015 |
| 21-week exponential average | 37.4% of 5,806 since 2010 | 18 Aug 2026 | 322 days from 11 Aug 2014 | 81.9% 20 Feb 2014 |
| 200-day average | 37.4% of 5,753 since 2011 | 18 Aug 2026 | 384 days from 14 Mar 2018 | 77.4% 18 Nov 2011 |
| 20-week simple average | 38.1% of 5,806 since 2010 | 18 Aug 2026 | 307 days from 13 Aug 2014 | 82.4% 21 Feb 2014 |
| 200-week average | 8.5% of 4,553 since 2014 | 16 Aug 2026 | 210 days from 19 Aug 2022 | 34.3% 21 Nov 2022 |
| Pi Cycle Bottom line | 17.0% of 5,482 since 2011 | 18 Aug 2026 | 283 days from 8 May 2022 | 57.2% 14 Jan 2015 |
How to read these levels
None of these lines is a floor. They are prices where the market has often found buyers before, so they are worth knowing when the price falls towards them. The moving averages trail the price: a short one such as the 20-week average is crossed many times in a year, while the 200-week average has been broken only in the deepest falls. The realized price is different in kind: it is the average price at which every bitcoin last moved, roughly what holders paid on average, so a price under it means the average holder is at a loss.
The power-law lines come from one fit of the price against the age of the network. Only 1% of all daily closes since 2010 sit below the 1% line, and 5% below the 5% line. A level that several measures share, or one the price has just closed under, tells you more than any single line.
How the levels are calculated
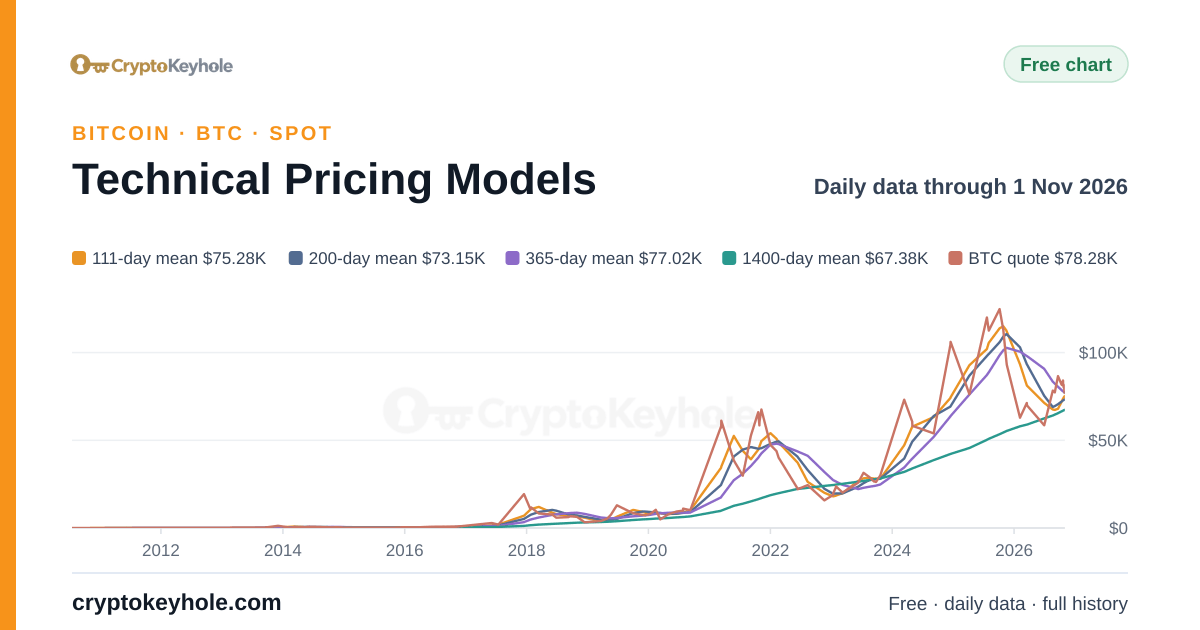
Every average is calculated from the BTC/USD daily closes (00:00 UTC) of our Free BTC price chart: the 200-day, 1-year (365-day) and 200-week (1,400-day) simple averages, the 20-week (140-day) simple and 21-week (147-day) exponential averages of the bull market support band, and the Pi Cycle Bottom line, the 471-day simple average times 0.745. They are the same lines as on our charts, read as a signed-out visitor sees them. The levels shown are those of the latest day every line has closed; the BTC price beside them is our latest hourly quote, so a day can pass before a level moves.
The realized price is the value of every coin at the price it last moved on chain, divided by the supply, from our own Bitcoin node; this page quotes only today's reading. The power-law lines are the 50%, 5% and 1% lines of the yearly power-law fit behind our power-law chart, evaluated at the latest day boundary; nothing is refitted here. The history table counts every daily close each average covers. Free to reuse under CC BY 4.0, crediting CryptoKeyhole with a link to this page.
Questions
Where is Bitcoin's support today?
Is Bitcoin above its 200-week moving average?
Is Bitcoin above its 200-day moving average?
What is the realized price of Bitcoin?
Are support levels a prediction?
No. They are prices where the market has often found buyers before, measured from our own data. A level can break, and the averages move every day: they rise behind a rising price and fall behind a falling one.
Open the pricing models chartAll free tools
Levels are calculated by CryptoKeyhole from our own node and price data and refreshed automatically. Nothing here is investment advice.