
Ask about this page
Our AI analyst answers questions about this page from CryptoKeyhole’s own data and charts. Free with an account.
Asking opens a free account in a few seconds (a username and a password, no email); then the answer appears here.
Four models, a year out
ModelRange for 8 Nov 2027: 80%, and the middle half darkerHow often past ranges held a year on
Resampled paths
The last four years of daily moves, reshuffled in 30-day blocks into 10,000 paths. The trend of those four years comes along.
$61,100 to $202,00081% held
close to its promise
Volatility cone
Today's price, spread by the last year's daily swings. No trend: as likely up as down.
$42,300 to $131,00060% held
too narrow, mostly missed above
Holders' cost band
What holders paid on average (the realized price, from our node), times the multiples the price has traded at on 80% of past days.
$47,900 to $143,00044% held
too narrow, mostly missed above
Power-law corridor
The 10% and 90% power-law lines through every close since 2010, refitted each January.
$127,000 to $326,00063% held
too narrow, mostly missed below
Cycle repeat
The 2012, 2016 and 2020 halving cycles' moves from the same day after their halving, applied to today's price.
$171,000 to $223,00031% held
three paths, no stated coverage
The models' ranges for 8 Nov 2027 do not all overlap: they disagree about the direction as well as the size of the move, from $42,300 at the lowest to $326,000 at the highest. The closest to its promise a year out has been the resampled paths: its 80% ranges held 81% of the time. The furthest from it has been the holders' cost band, at 44%, with the price ending above its range most of the times it missed. A wide range is not a cautious one unless it also holds: what counts is how often the price ended inside.
How often ranges like these held
An honest 80% range should hold about 80% of the time. Less, and the model was too sure of itself; more, and it was wider than it needed to be.
| Model | 1 month | 3 months | 6 months | 1 year |
|---|---|---|---|---|
| Resampled paths | 85%of 639 | 84%of 630 | 77%of 617 | 81%of 591 |
| Volatility cone | 79%of 5,556 | 73%of 5,496 | 72%of 5,406 | 60%of 5,221 |
| Holders' cost band | 81%of 741 | 72%of 733 | 55%of 721 | 44%of 694 |
| Power-law corridor | 66%of 4,656 | 66%of 4,600 | 64%of 4,510 | 63%of 4,325 |
| Cycle repeat | 43%of 2,334 | 43%of 2,274 | 42%of 2,184 | 31%of 1,999 |
Furthest miss of the resampled paths: the range made on 14 December 2017 reached down to −21% over 1 year; the price moved −80%.
Each test uses only what was known on the day: the volatility, the paths and the bands come from the days before it, the power-law fit from the closes before that 1 January. A range is then checked against the close that followed. The ranges overlap from one day to the next, so neighbouring tests are not independent, and a single strong run can sink or lift a whole year of them.
From a month to a year
| Ahead | Date | Middle half | 80% range | Past 80% ranges held |
|---|---|---|---|---|
| 1 month | 8 Dec 2026 | $71,100 to $83,000 | $65,500 to $92,600 | 85% |
| 3 months | 6 Feb 2027 | $70,300 to $95,800 | $61,400 to $111,000 | 84% |
| 6 months | 7 May 2027 | $72,500 to $113,000 | $59,400 to $138,000 | 77% |
| 1 year | 8 Nov 2027 | $80,600 to $152,000 | $61,100 to $202,000 | 81% |
The volatility cone, which leaves the trend out, gives $56,200 to $98,500 in 3 months, $42,300 to $131,000 in a year (80%).
If this cycle repeats an earlier one
The 2012 cycleThe 2016 cycleThe 2020 cycle
| Cycle | The same day then | In 3 months | In 6 months | In a year |
|---|---|---|---|---|
| The 2012 cycle | 18 Jun 2015 at $248.44 | $68,500 (−8%) | $139,000 (+86%) | $223,000 (+199%) |
| The 2016 cycle | 27 Jan 2019 at $3,565 | $109,000 (+47%) | $205,000 (+176%) | $186,000 (+150%) |
| The 2020 cycle | 29 Nov 2022 at $16,432 | $106,000 (+43%) | $127,000 (+71%) | $171,000 (+130%) |
Today is day 932 after the April 2024 halving. In each earlier cycle that day fell late in the bear market or early in the recovery, which is why all three paths climb. Three cycles are a very small sample, and their record shows it: tested on every day of the 2020 and 2024 cycles, the range between the earlier cycles' paths held only 31% of the time a year out and 43% three months out; the price ended below the lowest path 58% of the time.
The power-law corridor ahead
| Date | 10% line | Median line | 90% line |
|---|---|---|---|
| 31 Dec 2026 | $96,700 | $160,000 | $258,000 |
| 31 Dec 2027 | $133,000 | $220,000 | $339,000 |
| 31 Dec 2028 | $180,000 | $298,000 | $440,000 |
| 31 Dec 2030 | $317,000 | $523,000 | $711,000 |
| 31 Dec 2035 | $1,070,000 | $1,750,000 | $2,000,000 |
The power law draws Bitcoin's price as a straight line on log-log axes, and its lines keep rising, so the corridor a year out sits well above most other models. Out of sample, with each year's fit made only from the closes before it, the price a year later ended inside the 10%–90% corridor 63% of the time, below the 10% line 28% and above the 90% line 9%: the lines have run ahead of the price more often than behind it. Any date, and the day each line reaches a price, are in the power law calculator.
How calm or wild it is now
41% a yearDays at each level of one-year volatility189%
Over the last year Bitcoin moved 2.3% on a typical day, 44% a year in annual terms: calmer than on 93% of the days we can measure, against a median of 72%. The last 30 days ran at 36% a year. The cone uses this year's swings as they are, so a quiet year draws a narrow cone; quiet spells have often ended in a large move, which is one reason ranges miss.
How the ranges are made and tested
- Volatility cone. The standard deviation of the last 365 daily log returns (closed UTC days; a day with a missing close leaves its return out, and the cone needs at least 300), scaled by the square root of the days ahead. The middle half is today's price × e±0.674σ√t, the 80% range e±1.282σ√t. No drift: the middle of the range is today's price.
- Resampled paths. 10,000 paths of 365 days, each built from randomly chosen 30-day runs of the last four years' daily log returns (1,461 days), so streaks and calm spells stay as they happened and the four years' trend comes along. The ranges are the paths' 25th and 75th (middle half) and 10th and 90th (80%) percentiles on each day. The random draws are seeded, so the same closes give the same ranges.
- Holders' cost band. Bitcoin's realized price, from our own node, times the 10th, 25th, 75th and 90th percentiles of the ratio of price to realized price on every earlier day. The band assumes the realized price stays where it is.
- Power-law corridor. Quantile regressions of log price on log days since the genesis block, through every close from 17 July 2010 to the end of the year before (the fit the site publishes on the power law and rainbow charts), evaluated at the target date.
- Cycle repeat. Each earlier halving cycle's move from the same day count after its halving to the same day count plus the horizon, applied to today's price. The range runs from the lowest to the highest of the three; it has no stated coverage.
The record is a walk-forward test: on every past day (every seventh for the resampled paths and the cost band) we make the range with only the data available then, and check it against the close the horizon later. The volatility cone and resampled paths need a year and four years of history first; the cost band needs two years of the ratio. Horizons with fewer than 180 test days say "not yet". The models' settings (the windows, the block length, the percentiles) were chosen on 8 November 2026 with the whole history in view, and are kept fixed so the record stays comparable.
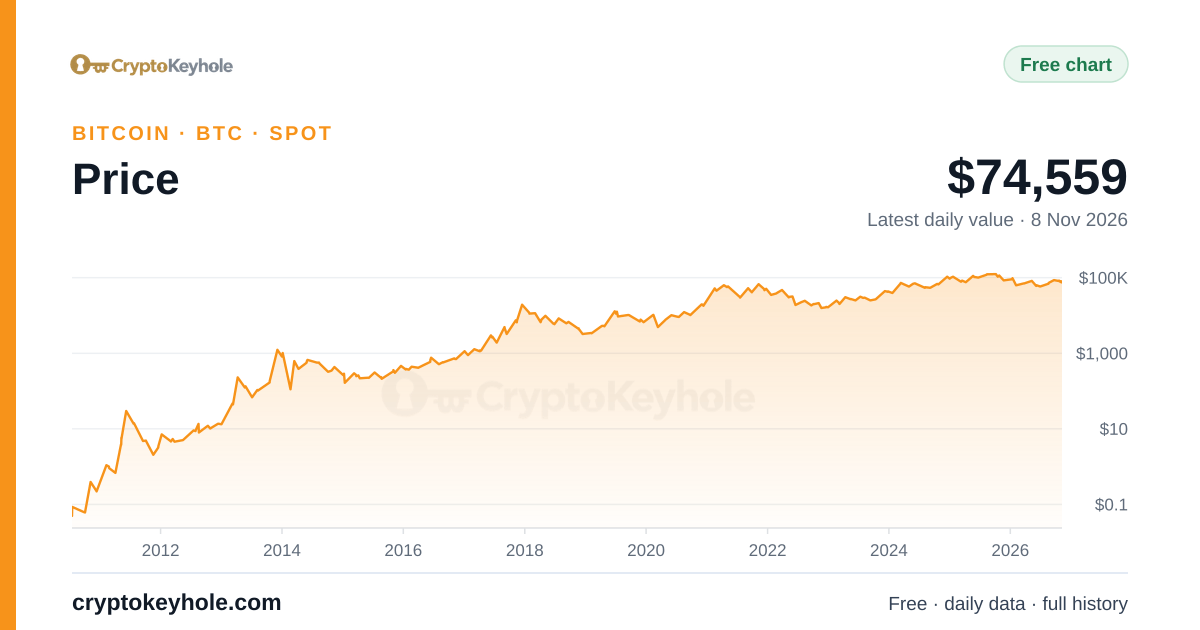
Prices are Bitcoin's daily closes as the site publishes them (the price chart; four erratic Bitcoin closes of February 2014 are left out of the tests). Everything is recomputed each hour as the price moves; the records change once a day, when a new close is in.
Questions
What will Bitcoin be worth in a year?
What is the Bitcoin price prediction for 2030?
Which Bitcoin price model has the best track record?
Is this a forecast?
No. Each range is what a simple model allows if its assumption holds, and the assumption is written next to it: that the next year's daily moves look like recent ones, that the price keeps to its past multiples of what holders paid, or that a long-run trend or an earlier cycle continues. The record shows how often that has been true. A range that held 80% of the time still missed one year in five.
Open the Bitcoin price chartAll free tools
Figures on this page are calculated by CryptoKeyhole from our own Bitcoin node and the price data we collect, and refreshed automatically; estimates say how they are made. Nothing here is investment advice.