
Ask about this page
Our AI analyst answers questions about this page from CryptoKeyhole’s own data and charts. Free with an account.
Asking opens a free account in a few seconds (a username and a password, no email); then the answer appears here.
How often ranges like these held
An honest 80% range should hold about 80% of the time. Less, and the model was too sure of itself; more, and it was wider than it needed to be.
| Model | 1 month | 3 months | 6 months | 1 year |
|---|---|---|---|---|
| Volatility cone | 84%of 906 | 73%of 846 | 77%of 756 | 39%of 571 |
Furthest miss of the volatility cone: the range made on 18 August 2025 reached down to −76% over 1 year; the price moved −92%.
Each test uses only what was known on the day: the volatility, the paths and the bands come from the days before it, the power-law fit from the closes before that 1 January. A range is then checked against the close that followed. The ranges overlap from one day to the next, so neighbouring tests are not independent, and a single strong run can sink or lift a whole year of them.
From a month to a year
| Ahead | Date | Middle half | 80% range | Past 80% ranges held |
|---|---|---|---|---|
| 1 month | 8 Dec 2026 | $0.00126 to $0.00177 | $0.00108 to $0.00206 | 84% |
| 3 months | 6 Feb 2027 | $0.00112 to $0.00201 | $0.000856 to $0.00261 | 73% |
| 6 months | 7 May 2027 | $0.000988 to $0.00227 | $0.000680 to $0.00329 | 77% |
| 1 year | 8 Nov 2027 | $0.000828 to $0.00270 | $0.000487 to $0.00460 | 39% |
How calm or wild it is now
88% a yearDays at each level of one-year volatility124%
Over the last year Gala moved 4.6% on a typical day, 88% a year in annual terms: calmer than on 100% of the days we can measure, against a median of 110%. The last 30 days ran at 74% a year. That is 2.0 times Bitcoin's 44%, so its ranges are about 2.0 times as wide in log terms. The cone uses this year's swings as they are, so a quiet year draws a narrow cone; quiet spells have often ended in a large move, which is one reason ranges miss.
How the ranges are made and tested
- Volatility cone. The standard deviation of the last 365 daily log returns (closed UTC days; a day with a missing close leaves its return out, and the cone needs at least 300), scaled by the square root of the days ahead. The middle half is today's price × e±0.674σ√t, the 80% range e±1.282σ√t. No drift: the middle of the range is today's price.
The record is a walk-forward test: on every past day (every seventh for the resampled paths and the cost band) we make the range with only the data available then, and check it against the close the horizon later. The volatility cone and resampled paths need a year and four years of history first; the cost band needs two years of the ratio. Horizons with fewer than 180 test days say "not yet". The models' settings (the windows, the block length, the percentiles) were chosen on 8 November 2026 with the whole history in view, and are kept fixed so the record stays comparable.
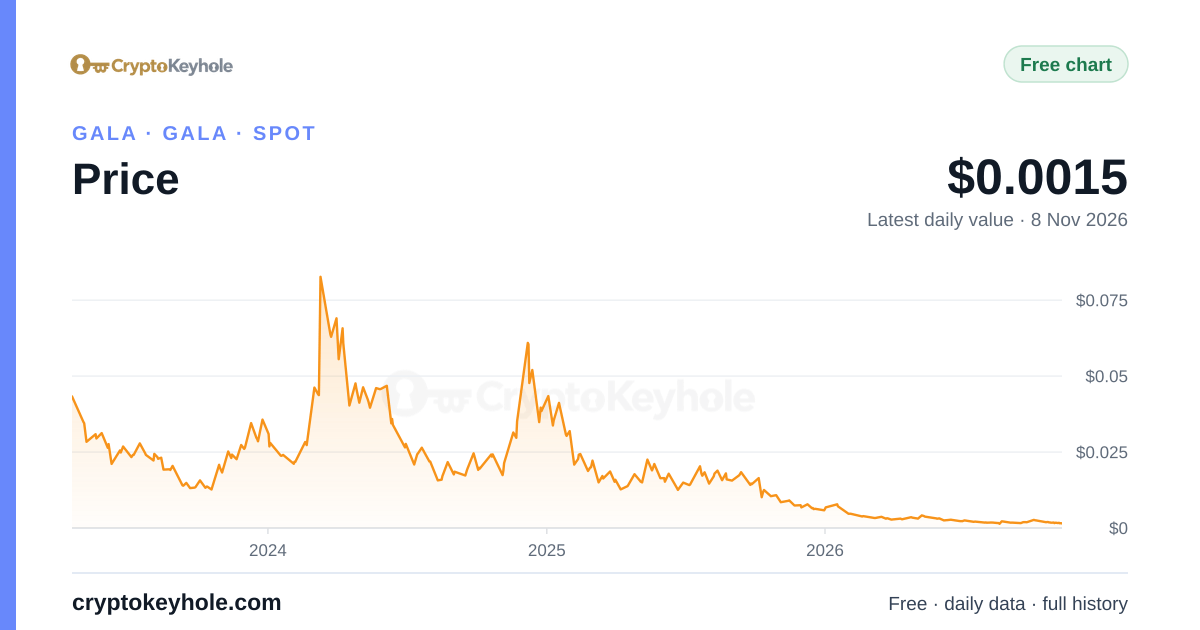
Prices are Gala's daily closes as the site publishes them (the price chart). Everything is recomputed each hour as the price moves; the records change once a day, when a new close is in.
Questions
What will Gala be worth in a year?
Is this a forecast?
No. Each range is what a simple model allows if its assumption holds, and the assumption is written next to it: that the next year's daily moves look like recent ones, that the price keeps to its past multiples of what holders paid, or that a long-run trend or an earlier cycle continues. The record shows how often that has been true. A range that held 80% of the time still missed one year in five.
Why only one model for Gala?
The other models need data from the coin's own chain (what holders paid, from a node we run) or a long cycle history, and we run nodes only for Bitcoin, Ethereum, Litecoin, Dogecoin and Bitcoin Cash. The volatility cone needs nothing but the price, so every coin with two years of daily closes has one.
How volatile is Gala?
Open the Gala price chartAll free tools
Figures on this page are calculated by CryptoKeyhole from our own Bitcoin node and the price data we collect, and refreshed automatically; estimates say how they are made. Nothing here is investment advice.