
The league of chains, a year on
Q3 2025
- 1Ethereum16,880
- 2Solana5,733
- 3Bitcoin4,445
- 4Monad2,913
- 5Base2,907
- 6Polygon2,835
- 7Arbitrum2,325
- 8Cosmos Network2,289
- 9Stellar1,785
- 10BNB Chain1,762
- 11Optimism1,590
- 12Sui1,496
Q3 2026
- 8,087Ethereum1
- 4,414Stellar2
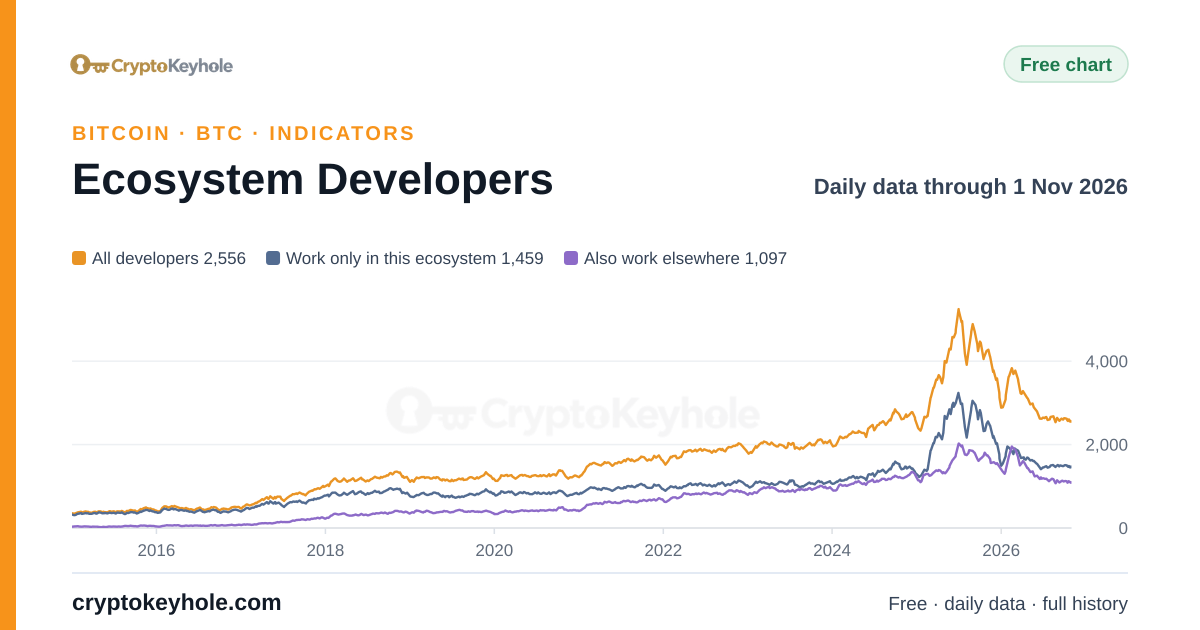
- 2,638Bitcoin3
- 2,608Monad4
- 2,608Solana5
- 1,279Base6
- 1,236Polygon7
- 1,190Cosmos Network8
- 1,184Arbitrum9
- 992Starknet10
- 791Polkadot Network11
- 751BNB Chain12
Ask about this page
Our AI analyst answers questions about this page from CryptoKeyhole’s own data and charts. Free with an account.
Asking opens a free account in a few seconds (a username and a password, no email); then the answer appears here.
Biggest movers over the year
Chains that grew most
- Stellar1,785 to 4,414+147.3%
- Lightning573 to 729+27.2%
- Hedera500 to 596+19.2%
- Starknet918 to 992+8.1%
Chains that shrank most
- Stacks1,222 to 271-77.8%
- Aptos1,011 to 328-67.6%
- Internet Computer1,060 to 370-65.1%
- Celo950 to 338-64.4%
- Sui1,496 to 599-60.0%
- Avalanche1,204 to 485-59.7%
How the work divides on the biggest chains
| Ecosystem | Developers | Full-time, part-time, one-off | Full-time |
|---|---|---|---|
| Ethereum | 8,087 | 34% | |
| Stellar | 4,414 | 12% | |
| Bitcoin | 2,638 | 35% | |
| Monad | 2,608 | 27% | |
| Solana | 2,608 | 27% | |
| Base | 1,279 | 24% | |
| Polygon | 1,236 | 27% | |
| Cosmos Network | 1,190 | 28% |
How this is counted
Each quarter uses the developer counts on its last day: everyone who committed code to a public repository of the ecosystem in the 28 days before. A developer who works in several ecosystems counts once in each, and once in the all-of-crypto total. Full-time, part-time and one-off are the source’s own levels of activity; under a year in crypto counts developers since their first commit to any crypto project.
The league, movers and work split cover chains only: tools, frameworks and research groups in the source’s taxonomy can jump when a project is reclassified. The total counts everything the source counts as crypto.
Open Dev Data by Electric Capital (opendevdata.org), used under CC BY 4.0: developers who committed to public repositories that its open taxonomy assigns to each ecosystem, on its own 28-day rolling method. Ecosystems can gain or lose repositories over time, which moves the past as well.
Coverage and limits
- Only public code on GitHub is seen: private repositories and work that never reaches a public commit are not counted.
- The ecosystems are assigned by an open taxonomy that changes, so a project joining an ecosystem lifts its past as well.
- This page shows calendar quarters; Q3 2026 is the latest that has ended, and the live counts are on the Crypto Developer Activity page.
Questions
How many developers work in crypto?
Which blockchain has the most developers?
Where does this data come from?
Open Dev Data by Electric Capital, published under CC BY 4.0. CryptoKeyhole reads the two tables it needs and keeps the counts on this page.
Developer activityGet the dataAll free tools
Counts are Open Dev Data’s, arranged by CryptoKeyhole.