
Ask about this page
Our AI analyst answers questions about this page from CryptoKeyhole’s own data and charts. Free with an account.
Asking opens a free account in a few seconds (a username and a password, no email); then the answer appears here.
Why people call it deflationary
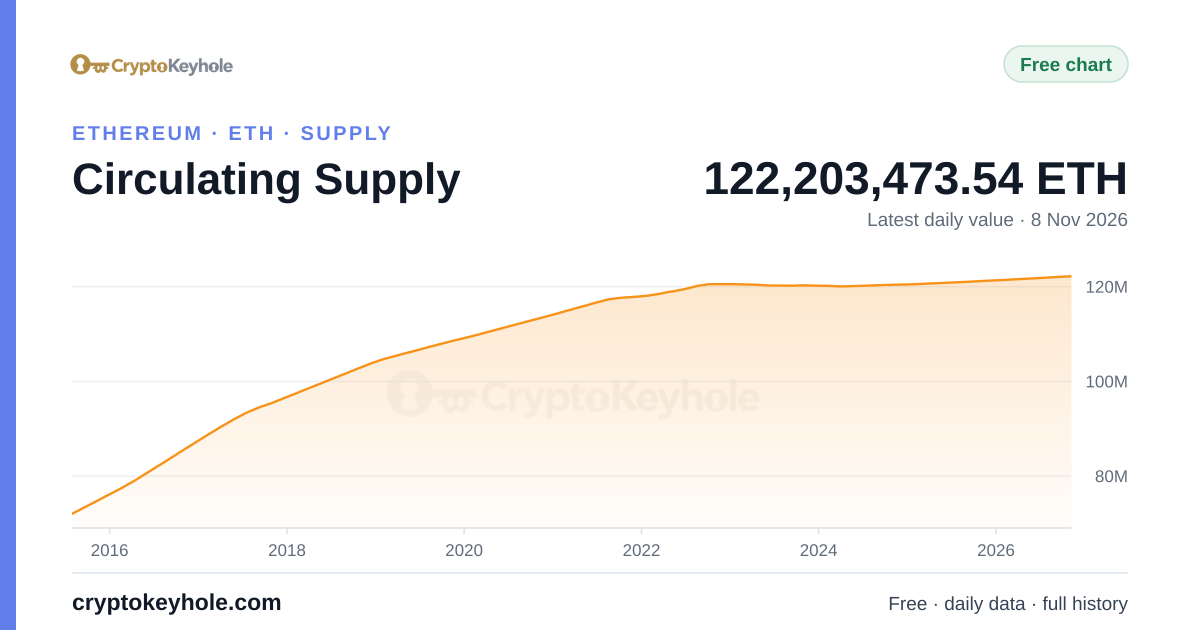
Two upgrades started the argument. Since the London upgrade of August 2021 the base fee of every transaction has been destroyed. Since the Merge of September 2022 new ETH goes only to validators, far less than miners were paid before. Together they made a shrinking supply possible, and for a while it did shrink.
- Issuance
- New ETH paid to validators for proposing blocks and attesting to them. It never stops.
- The burn
- The base fee of every transaction, destroyed rather than paid to anyone. It rises and falls with demand for block space.
- Change in supply
- Falls only while the burn is larger than issuance.
So the supply falls only while block space stays in heavy demand. The price of that space decides it, and the price has changed enormously.
| What a day looked like | Longest shrinking stretch | Last 30 days |
|---|---|---|
| Dates | 13 Jan 2023 to 8 Sep 2023 | 10 Oct 2026 to 8 Nov 2026 |
| Median gas price | 29.1 gwei | 0.22 gwei |
| Gas used per day | 108 billion | 218 billion |
During the longest stretch when the supply kept falling, a typical transaction paid about 29.1 gwei per unit of gas. Over the last 30 days it paid about 0.22 gwei, 134 times less, while the chain used more gas each day. Ethereum does more work at a far lower price, and the burn no longer keeps up with issuance. Source: the Gas Price (Median) and Gas Used (Total) charts.
The charts behind this
These charts show the burn and issuance themselves, day by day.
In more detail Plus
- Burned Supply: all the ETH destroyed since the base-fee burn began.
- Daily Supply Burned: how much was destroyed each day.
- Burn Rate (Base Fee): the same burn as a rate, in ETH per period.
- Issuance: the new ETH paid out to validators.
- Proof-of-Stake Net Supply Change: issuance minus the burn, day by day.
- Proof-of-Stake Net Supply Issuance: the running total of that net change since the Merge.
- Proof-of-Stake Net Inflation Rate: the same net change as a yearly rate of the supply.
- Annual Rate of Supply Issuance, Minting, and Burning: issuance, minting and the burn side by side, a year at a time.
- Percent of Minted Supply Burned: the share of newly minted ETH that has been destroyed.
Questions
Was Ethereum ever deflationary?
Is ETH still ultrasound money?
What makes ETH supply go down?
Only the burn. The base fee of every transaction is destroyed, so supply falls when the fees destroyed are larger than the new ETH paid to validators. That takes sustained heavy use of block space.
How does CryptoKeyhole measure the supply?
We add the ETH held by execution-layer accounts to the consensus layer's ledger: deposits into the staking contract, minus withdrawals paid out, plus validator rewards net of penalties. Deposits and withdrawals are exact from our own node. Rewards are exact at the end of every UTC day whose closing beacon state our node has read; a day without a reading takes its share of the change between the exact readings on either side from the protocol's reward schedule, and the open day runs at the previous day's rate until its closing state is read.
How often is this updated?
Hourly, from our own node. The open day is labelled as today so far until it closes, and the time of the last data is printed beside the reading.
Open the supply chartSupply and burn dashboardAll free tools
Figures on this page are counted by CryptoKeyhole from our own Ethereum node and refreshed automatically.