
What is driving it today
Monero's CryptoKeyhole Fear & Greed reading of 58 is 8 points above neutral (50). Pushing it towards greed: funding rates (score 88, +7.6 points) and volatility (score 77, +5.3 points). Pulling it towards fear: price momentum (score 39, −3.8 points) and taker flow (score 36, −1.8 points). Strongest signal: funding rates. +0.0288% per 8 hours (7-day mean of the median venue). By group: price action 53 (neutral), derivatives positioning 66 (greed) and attention 49 (neutral).
| Component | Score | Leans to | Weight | Today's reading |
|---|---|---|---|---|
| Price momentum | 39 | Fear | 33% | Price −3.8% against its 30-day average and +6.8% against its 90-day average |
| Volatility | 77 | Greed | 20% | 50% a year (30-day volatility of daily returns, annualised) |
| Funding rates | 88 | Greed | 20% | +0.0288% per 8 hours (7-day mean of the median venue) |
| Taker flow | 36 | Fear | 13% | Takers bought 49.4% of Binance volume over 7 days (spot and perpetuals) |
| Long/short ratio | 57 | Greed | 7% | 2.04 accounts long for every account short (7-day mean), on Bybit |
| Attention | 49 | Neutral | 7% | Wikipedia views 0.92× their 90-day average (7-day mean) |
Not in this reading: open interest (we have no Bybit perpetual open-interest record for it); holder profit (no on-chain profit measure: we do not run this network's node); exchange flows (no on-chain exchange flows: we do not run this network's node); options implied volatility (its options have no implied volatility index; Deribit publishes one for Bitcoin and Ether). Their weight is shared among the components above.
The component chart shows each component's score day by day; the market page compares every coin.
Ask about this page
Our AI analyst answers questions about this page from CryptoKeyhole’s own data and charts. Free with an account.
Asking opens a free account in a few seconds (a username and a password, no email); then the answer appears here.
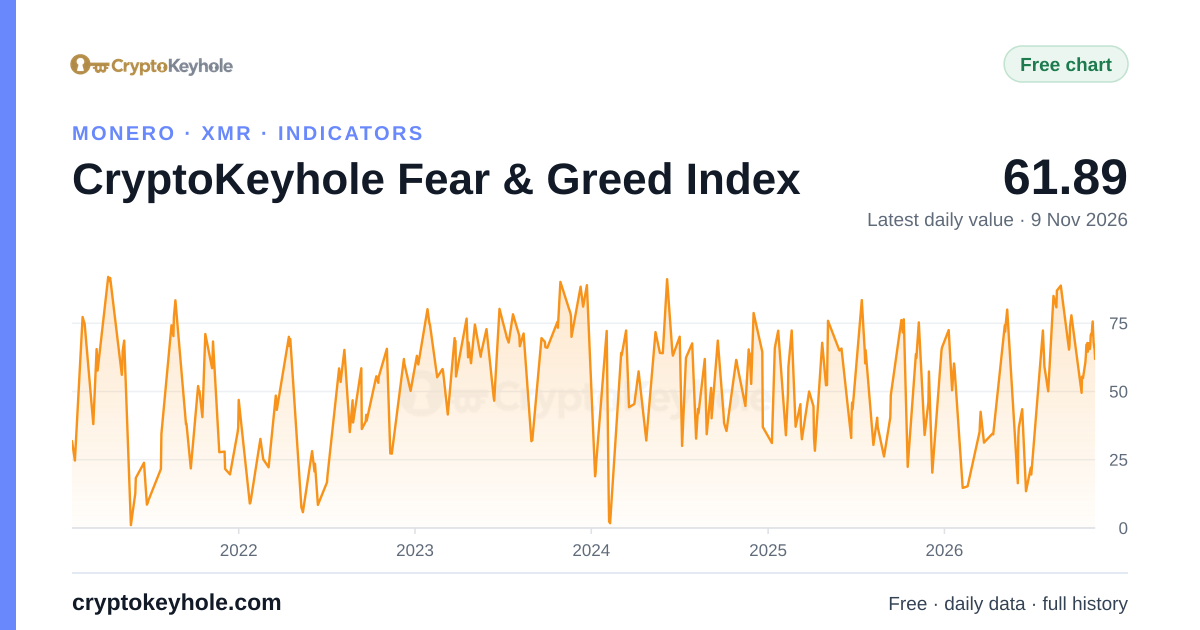
The Monero index over time
The Monero index between two dates
By CryptoKeyhole's daily readings, from 10 November 2025 to today, the Monero Fear & Greed Index went from 67 (greed) to 58 (greed) so far, down 9 points. Its highest reading in that span was 76 (extreme greed) on 30 August 2026, and its lowest 15 (extreme fear) on 19 June 2026. It averaged 48 (neutral), with 40 days in extreme fear and 1 day in extreme greed.
- 10 Nov 2025 reading
- 67
- final · greed
- Today so far
- 58
- today · greed
- Change
- −9
- points, 365 days
- Highest reading
- 76
- 30 Aug 2026 · extreme greed
- Lowest reading
- 15
- 19 Jun 2026 · extreme fear
- Average
- 48
- neutral
- Days in extreme fear
- 40
- of 365 days
- Days in extreme greed
- 1
- of 365 days
Each reading is one UTC day's value, labelled as our chart labels it (final); the highest and lowest are closed days only, never today so far.
Each span runs from the first reading of its first month to the last reading of its last, both months included. Choose one to see it in the picker above.
A year apart
| Span | First reading | Last reading | Change | Highest reading | Lowest reading | Average |
|---|---|---|---|---|---|---|
| November 2025 to November 2026 so far | 60 greed | 58 today | −2 | 76 30 Aug 2026 | 15 19 Jun 2026 | 48 neutral |
| October 2025 to October 2026 | 58 greed | 71 greed | +13 | 76 30 Aug 2026 | 15 19 Jun 2026 | 48 neutral |
| September 2025 to September 2026 | 28 fear | 53 neutral | +25 | 76 30 Aug 2026 | 15 19 Jun 2026 | 47 neutral |
| August 2025 to August 2026 | 43 fear | 75 greed | +32 | 76 30 Aug 2026 | 15 19 Jun 2026 | 45 neutral |
| July 2025 to July 2026 | 51 neutral | 54 neutral | +3 | 76 14 Jul 2025 | 15 19 Jun 2026 | 44 fear |
| June 2025 to June 2026 | 65 greed | 23 extreme fear | −42 | 76 14 Jul 2025 | 15 19 Jun 2026 | 44 fear |
| May 2025 to May 2026 | 54 neutral | 30 fear | −24 | 76 14 Jul 2025 | 17 18 Feb 2026 | 47 neutral |
| April 2025 to April 2026 | 51 neutral | 59 greed | +8 | 76 14 Jul 2025 | 17 18 Feb 2026 | 47 neutral |
| March 2025 to March 2026 | 53 neutral | 33 fear | −20 | 76 14 Jul 2025 | 17 18 Feb 2026 | 47 neutral |
| February 2025 to February 2026 | 66 greed | 24 extreme fear | −42 | 76 14 Jul 2025 | 17 18 Feb 2026 | 49 neutral |
| January 2025 to January 2026 | 59 greed | 31 fear | −28 | 76 14 Jul 2025 | 23 7 Dec 2025 | 52 neutral |
| December 2024 to December 2025 | 63 greed | 54 neutral | −9 | 76 14 Jul 2025 | 23 7 Dec 2025 | 53 neutral |
| November 2024 to November 2025 | 51 neutral | 58 greed | +7 | 76 14 Jul 2025 | 26 25 Aug 2025 | 53 neutral |
| October 2024 to October 2025 | 40 fear | 55 neutral | +15 | 76 14 Jul 2025 | 26 25 Aug 2025 | 53 neutral |
| September 2024 to September 2025 | 55 neutral | 53 neutral | −2 | 76 14 Jul 2025 | 26 25 Aug 2025 | 53 neutral |
| August 2024 to August 2025 | 53 neutral | 28 fear | −25 | 76 14 Jul 2025 | 26 25 Aug 2025 | 53 neutral |
| July 2024 to July 2025 | 65 greed | 45 neutral | −20 | 76 14 Jul 2025 | 33 6 Apr 2025 | 54 neutral |
| June 2024 to June 2025 | 70 greed | 60 greed | −10 | 85 6 Jun 2024 | 33 6 Apr 2025 | 55 neutral |
| May 2024 to May 2025 | 48 neutral | 64 greed | +16 | 85 6 Jun 2024 | 33 6 Apr 2025 | 56 greed |
| April 2024 to April 2025 | 47 neutral | 55 neutral | +8 | 85 6 Jun 2024 | 33 6 Apr 2025 | 54 neutral |
| March 2024 to March 2025 | 57 greed | 50 neutral | −7 | 85 6 Jun 2024 | 34 7 Jul 2024 | 55 neutral |
| February 2024 to February 2025 | 70 greed | 49 neutral | −21 | 85 6 Jun 2024 | 17 16 Feb 2024 | 54 neutral |
| January 2024 to January 2025 | 70 greed | 65 greed | −5 | 85 6 Jun 2024 | 17 16 Feb 2024 | 54 neutral |
| December 2023 to December 2024 | 78 extreme greed | 58 greed | −20 | 85 6 Jun 2024 | 17 16 Feb 2024 | 55 neutral |
Within a year
Between any two months of 2026
| From | Jan | Feb | Mar | Apr | May | Jun | Jul | Aug | Sep | Oct | Nov | Dec |
|---|---|---|---|---|---|---|---|---|---|---|---|---|
| January | −18 | −25 | −16 | +10 | −19 | −26 | +5 | +26 | +4 | +22 | +9 | |
| February | 0 | +9 | +35 | +6 | −1 | +30 | +51 | +29 | +47 | +34 | ||
| March | +8 | +34 | +5 | −2 | +29 | +50 | +28 | +46 | +33 | |||
| April | +26 | −3 | −10 | +21 | +42 | +20 | +38 | +25 | ||||
| May | −28 | −35 | −4 | +17 | −5 | +13 | 0 | |||||
| June | +1 | +32 | +53 | +31 | +49 | +36 | ||||||
| July | +31 | +52 | +30 | +48 | +35 | |||||||
| August | +19 | −3 | +15 | +2 | ||||||||
| September | −19 | −1 | −14 | |||||||||
| October | +18 | +5 | ||||||||||
| November | −13 |
Between any two months of 2025
| From | Jan | Feb | Mar | Apr | May | Jun | Jul | Aug | Sep | Oct | Nov | Dec |
|---|---|---|---|---|---|---|---|---|---|---|---|---|
| January | +6 | −10 | −9 | −4 | +5 | +1 | −14 | −31 | −6 | −4 | −1 | −5 |
| February | −17 | −16 | −11 | −2 | −6 | −21 | −38 | −13 | −11 | −8 | −12 | |
| March | −3 | +2 | +11 | +7 | −8 | −25 | 0 | +2 | +5 | +1 | ||
| April | +4 | +13 | +9 | −6 | −23 | +2 | +4 | +7 | +3 | |||
| May | +10 | +6 | −9 | −26 | −1 | +1 | +4 | 0 | ||||
| June | −5 | −20 | −37 | −12 | −10 | −7 | −11 | |||||
| July | −6 | −23 | +2 | +4 | +7 | +3 | ||||||
| August | −15 | +10 | +12 | +15 | +11 | |||||||
| September | +25 | +27 | +30 | +26 | ||||||||
| October | −3 | 0 | −4 | |||||||||
| November | −2 | −6 | ||||||||||
| December | +2 |
Between any two months of 2024
| From | Jan | Feb | Mar | Apr | May | Jun | Jul | Aug | Sep | Oct | Nov | Dec |
|---|---|---|---|---|---|---|---|---|---|---|---|---|
| January | −2 | −21 | −21 | −26 | 0 | −5 | −13 | −15 | −24 | −18 | −10 | −12 |
| February | −21 | −21 | −26 | 0 | −5 | −13 | −15 | −24 | −18 | −10 | −12 | |
| March | −8 | −13 | +13 | +8 | 0 | −2 | −11 | −5 | +3 | +1 | ||
| April | −3 | +23 | +18 | +10 | +8 | −1 | +5 | +13 | +11 | |||
| May | +22 | +17 | +9 | +7 | −2 | +4 | +12 | +10 | ||||
| June | −5 | −13 | −15 | −24 | −18 | −10 | −12 | |||||
| July | −8 | −10 | −19 | −13 | −5 | −7 | ||||||
| August | +2 | −7 | −1 | +7 | +5 | |||||||
| September | −9 | −3 | +5 | +3 | ||||||||
| October | +12 | +20 | +18 | |||||||||
| November | +9 | +7 | ||||||||||
| December | −5 |
What followed fear and greed
By CryptoKeyhole's back-test of the Monero Fear & Greed Index since 2020, after days of extreme fear, Monero's price was higher 90 days later 88% of the time (median +19.0%); after extreme greed, 55% of the time (median +2.0%), against 62% of all days (median +6.9%).
| Reading | Days | Median change after 30 days | Higher after 30 days | Median change after 90 days | Higher after 90 days | Median change after a year | Higher after a year |
|---|---|---|---|---|---|---|---|
| Extreme fear | 180 18 spells | +8.8% | 67% | +19.0% | 88% | −10.0% | 46% |
| Fear | 554 83 spells | +8.4% | 70% | +8.7% | 60% | +16.6% | 57% |
| Neutral | 515 145 spells | +3.0% | 57% | +6.7% | 61% | +37.5% | 75% |
| Greed | 994 125 spells | +1.2% | 52% | +4.0% | 59% | +16.4% | 62% |
| Extreme greed | 156 31 spells | −1.5% | 44% | +2.0% | 55% | +17.8% | 62% |
| All days | 2,399 | +3.3% | 58% | +6.9% | 62% | +17.7% | 63% |
Every closed day since 17 March 2020 counts once, by its zone. The market page sets out how the back-test is counted; past results are not a forecast.
How it works
Monero's index is the weighted mean of its components today (price momentum, volatility, funding rates, taker flow, long/short ratio, attention), each scored from 0 to 100 against its own past two years: below 25 is extreme fear, 25 to 44 fear, 45 to 55 neutral, 56 to 75 greed and above 75 extreme greed. The market page explains how each component is calculated, how to read the index and how it differs from other fear and greed indexes.
The last 30 days
| Day | Index | Zone | Change |
|---|---|---|---|
| 10 November 2026 (today so far) | 58 | Greed | −4 |
| 9 November 2026 | 62 | Greed | −3 |
| 8 November 2026 | 65 | Greed | −1 |
| 7 November 2026 | 66 | Greed | −2 |
| 6 November 2026 | 68 | Greed | −3 |
| 5 November 2026 | 71 | Greed | −4 |
| 4 November 2026 | 75 | Greed | +2 |
| 3 November 2026 | 73 | Greed | +3 |
| 2 November 2026 | 70 | Greed | −1 |
| 1 November 2026 | 71 | Greed | 0 |
| 31 October 2026 | 71 | Greed | +4 |
| 30 October 2026 | 67 | Greed | +1 |
| 29 October 2026 | 66 | Greed | −1 |
| 28 October 2026 | 67 | Greed | −1 |
| 27 October 2026 | 68 | Greed | +2 |
| 26 October 2026 | 66 | Greed | +1 |
| 25 October 2026 | 65 | Greed | −3 |
| 24 October 2026 | 68 | Greed | +3 |
| 23 October 2026 | 65 | Greed | −2 |
| 22 October 2026 | 67 | Greed | +4 |
| 21 October 2026 | 63 | Greed | +2 |
| 20 October 2026 | 61 | Greed | 0 |
| 19 October 2026 | 61 | Greed | +1 |
| 18 October 2026 | 60 | Greed | +7 |
| 17 October 2026 | 53 | Neutral | +2 |
| 16 October 2026 | 51 | Neutral | +2 |
| 15 October 2026 | 49 | Neutral | +1 |
| 14 October 2026 | 48 | Neutral | −1 |
| 13 October 2026 | 49 | Neutral | +5 |
| 12 October 2026 | 44 | Fear | −4 |
What its history shows
- Over the past 12 months: high 76 (extreme greed) on 30 August 2026, low 15 (extreme fear) on 19 June 2026, average 48.
- Highest reading: 89 on 6 August 2020. Lowest: 11 on 19 May 2021.
- Across all 2,430 days since 17 March 2020: extreme fear 7% of days, fear 23%, neutral 21%, greed 42%, extreme greed 6%.
| Year | Average | Range | Days of extreme fear | Days of extreme greed | Days |
|---|---|---|---|---|---|
| 2026 | 47 | 15–76 | 39 | 1 | 314 |
| 2025 | 52 | 23–76 | 1 | 1 | 365 |
| 2024 | 53 | 17–85 | 13 | 5 | 366 |
| 2023 | 66 | 36–84 | 0 | 64 | 365 |
| 2022 | 41 | 11–70 | 62 | 0 | 365 |
| 2021 | 45 | 11–85 | 58 | 19 | 365 |
| 2020 | 65 | 12–89 | 7 | 66 | 290 |
Monero's longest run of extreme fear lasted 30 days, from 21 June 2021 to 20 July 2021, while its price went from $203.05 to $182.89; its last day of extreme fear was 1 July 2026. Monero's longest run of extreme greed lasted 26 days, from 28 November 2023 to 23 December 2023, while its price went from $167.60 to $178.50; its last day of extreme greed was 30 August 2026.
The Monero index by month
CryptoKeyhole's daily readings month by month (00:00 UTC days; the lowest and highest are the first day with that reading):
2026 by month
| Month | Average | Lowest | Highest | Days of extreme fear | Days of extreme greed | Days |
|---|---|---|---|---|---|---|
| November so far | 68 Greed | 58 10 Nov | 75 4 Nov | 0 | 0 | 10 |
| October | 57 Greed | 44 12 Oct | 71 31 Oct | 0 | 0 | 31 |
| September | 66 Greed | 53 30 Sep | 73 4 Sep | 0 | 0 | 30 |
| August | 68 Greed | 48 4 Aug | 76 30 Aug | 0 | 1 | 31 |
| July | 47 Neutral | 23 1 Jul | 70 24 Jul | 1 | 0 | 31 |
| June | 27 Fear | 15 19 Jun | 46 11 Jun | 10 | 0 | 30 |
| May | 54 Neutral | 30 30 May | 66 9 May | 0 | 0 | 31 |
| April | 42 Fear | 28 8 Apr | 60 21 Apr | 0 | 0 | 30 |
| March | 33 Fear | 25 1 Mar | 45 17 Mar | 0 | 0 | 31 |
| February | 20 Extreme fear | 17 17 Feb | 24 1 Feb | 28 | 0 | 28 |
| January | 49 Neutral | 29 25 Jan | 63 12 Jan | 0 | 0 | 31 |
2025 by month
| Month | Average | Lowest | Highest | Days of extreme fear | Days of extreme greed | Days |
|---|---|---|---|---|---|---|
| December | 47 Neutral | 23 7 Dec | 57 21 Dec | 1 | 0 | 31 |
| November | 57 Greed | 38 21 Nov | 69 9 Nov | 0 | 0 | 30 |
| October | 50 Neutral | 26 17 Oct | 68 8 Oct | 0 | 0 | 31 |
| September | 46 Neutral | 28 1 Sep | 61 16 Sep | 0 | 0 | 30 |
| August | 36 Fear | 26 25 Aug | 44 3 Aug | 0 | 0 | 31 |
| July | 59 Greed | 44 30 Jul | 76 14 Jul | 0 | 1 | 31 |
| June | 54 Neutral | 42 22 Jun | 65 1 Jun | 0 | 0 | 30 |
| May | 64 Greed | 54 1 May | 73 13 May | 0 | 0 | 31 |
| April | 46 Neutral | 33 6 Apr | 66 23 Apr | 0 | 0 | 30 |
| March | 47 Neutral | 36 12 Mar | 62 6 Mar | 0 | 0 | 31 |
| February | 58 Greed | 40 7 Feb | 71 19 Feb | 0 | 0 | 28 |
| January | 61 Greed | 42 9 Jan | 72 18 Jan | 0 | 0 | 31 |
2024 by month
| Month | Average | Lowest | Highest | Days of extreme fear | Days of extreme greed | Days |
|---|---|---|---|---|---|---|
| December | 59 Greed | 40 21 Dec | 74 2 Dec | 0 | 0 | 31 |
| November | 52 Neutral | 44 15 Nov | 60 19 Nov | 0 | 0 | 30 |
| October | 50 Neutral | 38 2 Oct | 62 27 Oct | 0 | 0 | 31 |
| September | 55 Neutral | 45 29 Sep | 65 19 Sep | 0 | 0 | 30 |
| August | 49 Neutral | 36 5 Aug | 64 23 Aug | 0 | 0 | 31 |
| July | 54 Neutral | 34 7 Jul | 67 2 Jul | 0 | 0 | 31 |
| June | 66 Greed | 53 23 Jun | 85 6 Jun | 0 | 5 | 30 |
| May | 62 Greed | 46 2 May | 70 31 May | 0 | 0 | 31 |
| April | 44 Fear | 38 13 Apr | 58 29 Apr | 0 | 0 | 30 |
| March | 57 Greed | 47 19 Mar | 68 13 Mar | 0 | 0 | 31 |
| February | 36 Fear | 17 16 Feb | 72 2 Feb | 13 | 0 | 29 |
| January | 51 Neutral | 31 9 Jan | 73 29 Jan | 0 | 0 | 31 |
2023 by month
| Month | Average | Lowest | Highest | Days of extreme fear | Days of extreme greed | Days |
|---|---|---|---|---|---|---|
| December | 78 Extreme greed | 65 31 Dec | 84 18 Dec | 0 | 27 | 31 |
| November | 74 Greed | 64 21 Nov | 83 3 Nov | 0 | 14 | 30 |
| October | 69 Greed | 59 2 Oct | 81 30 Oct | 0 | 3 | 31 |
| September | 53 Neutral | 36 5 Sep | 66 19 Sep | 0 | 0 | 30 |
| August | 53 Neutral | 39 31 Aug | 63 14 Aug | 0 | 0 | 31 |
| July | 67 Greed | 56 30 Jul | 73 1 Jul | 0 | 0 | 31 |
| June | 60 Greed | 47 16 Jun | 74 25 Jun | 0 | 0 | 30 |
| May | 68 Greed | 61 19 May | 80 5 May | 0 | 5 | 31 |
| April | 74 Greed | 69 21 Apr | 82 18 Apr | 0 | 10 | 30 |
| March | 63 Greed | 48 8 Mar | 77 24 Mar | 0 | 2 | 31 |
| February | 65 Greed | 56 16 Feb | 75 1 Feb | 0 | 0 | 28 |
| January | 68 Greed | 60 2 Jan | 80 28 Jan | 0 | 3 | 31 |
2022 by month
| Month | Average | Lowest | Highest | Days of extreme fear | Days of extreme greed | Days |
|---|---|---|---|---|---|---|
| December | 58 Greed | 52 7 Dec | 64 9 Dec | 0 | 0 | 31 |
| November | 46 Neutral | 28 11 Nov | 70 4 Nov | 0 | 0 | 30 |
| October | 54 Neutral | 42 2 Oct | 65 31 Oct | 0 | 0 | 31 |
| September | 48 Neutral | 38 13 Sep | 59 9 Sep | 0 | 0 | 30 |
| August | 48 Neutral | 39 24 Aug | 62 17 Aug | 0 | 0 | 31 |
| July | 38 Fear | 15 3 Jul | 59 28 Jul | 6 | 0 | 31 |
| June | 20 Extreme fear | 11 13 Jun | 29 2 Jun | 26 | 0 | 30 |
| May | 27 Fear | 16 16 May | 41 4 May | 11 | 0 | 31 |
| April | 56 Greed | 38 6 Apr | 68 18 Apr | 0 | 0 | 30 |
| March | 39 Fear | 29 4 Mar | 51 8 Mar | 0 | 0 | 31 |
| February | 29 Fear | 18 2 Feb | 41 15 Feb | 7 | 0 | 28 |
| January | 30 Fear | 16 22 Jan | 52 1 Jan | 12 | 0 | 31 |
2021 by month
| Month | Average | Lowest | Highest | Days of extreme fear | Days of extreme greed | Days |
|---|---|---|---|---|---|---|
| December | 31 Fear | 24 5 Dec | 40 31 Dec | 1 | 0 | 31 |
| November | 44 Fear | 28 22 Nov | 64 9 Nov | 0 | 0 | 30 |
| October | 47 Neutral | 35 18 Oct | 67 24 Oct | 0 | 0 | 31 |
| September | 37 Fear | 24 21 Sep | 60 5 Sep | 1 | 0 | 30 |
| August | 61 Greed | 46 31 Aug | 73 23 Aug | 0 | 0 | 31 |
| July | 27 Fear | 14 1 Jul | 52 29 Jul | 20 | 0 | 31 |
| June | 21 Extreme fear | 16 1 Jun | 30 17 Jun | 23 | 0 | 30 |
| May | 38 Fear | 11 19 May | 65 7 May | 13 | 0 | 31 |
| April | 74 Greed | 56 29 Apr | 85 4 Apr | 0 | 17 | 30 |
| March | 59 Greed | 41 6 Mar | 79 31 Mar | 0 | 2 | 31 |
| February | 63 Greed | 48 1 Feb | 74 12 Feb | 0 | 0 | 28 |
| January | 42 Fear | 30 27 Jan | 65 10 Jan | 0 | 0 | 31 |
2020 by month
| Month | Average | Lowest | Highest | Days of extreme fear | Days of extreme greed | Days |
|---|---|---|---|---|---|---|
| December | 69 Greed | 51 1 Dec | 83 26 Dec | 0 | 8 | 31 |
| November | 55 Neutral | 45 7 Nov | 67 1 Nov | 0 | 0 | 30 |
| October | 75 Greed | 64 20 Oct | 84 5 Oct | 0 | 17 | 31 |
| September | 56 Greed | 35 5 Sep | 75 1 Sep | 0 | 0 | 30 |
| August | 75 Greed | 57 27 Aug | 89 6 Aug | 0 | 17 | 31 |
| July | 75 Greed | 65 1 Jul | 85 31 Jul | 0 | 14 | 31 |
| June | 68 Greed | 56 27 Jun | 77 10 Jun | 0 | 2 | 30 |
| May | 71 Greed | 61 24 May | 79 13 May | 0 | 7 | 31 |
| April | 61 Greed | 42 1 Apr | 77 29 Apr | 0 | 1 | 30 |
| March | 24 Extreme fear | 12 17 Mar | 38 31 Mar | 7 | 0 | 15 |
Cite, download and reuse
Cite this reading
CryptoKeyhole Monero Fear & Greed Index: 58 out of 100 (greed) at 04:00 UTC on 10 November 2026. https://cryptokeyhole.com/fear-and-greed-index/xmr/
The readings and their history are free to reuse under CC BY 4.0, crediting CryptoKeyhole with a link to this page. The history is recalculated from our charts as they are published now, so a corrected input also corrects the days it touches.
Questions
What is the Monero Fear and Greed Index?
A daily reading from 0 to 100 of how fearful or greedy the Monero market is, calculated by CryptoKeyhole from XMR's own price momentum, volatility, derivatives positioning, order flow and, where we have them, on-chain and attention data. Each part is ranked against its own past two years.
Is the Monero market fearful or greedy today?
The reading at the top of this page answers it, with its zone. It updates every hour; today's value is a partial reading until the day closes at 00:00 UTC.
How is it different from the usual crypto fear and greed index?
It is calculated separately for each coin, from our own market and derivatives data rather than social media, and every component, weight and reading is published on the page.
Open the interactive chartComponent scoresEvery coin's indexCreate a free account
Readings on this page are calculated by CryptoKeyhole from its own price indexes of public exchange markets, its collection of the venues' public derivatives data and Wikimedia's public page views, and are refreshed every hour; the method section above gives each source.